canvas是HTML5的一个新添加的元素,HTML5 canvas是一个原生HTML绘图薄,用于Javascript代码,不使用第三方工具。
canvas部分方法列表:
| 方法 | 用途 |
|---|---|
getContext(contextId) |
公开在 canvas 上绘图需要的 API。惟一(当前)可用的 contextID 是 2d。 |
height |
设置 canvas 的高度。默认值是 150 像素。 |
width |
设置 canvas 的宽度。默认值是 300 像素。 |
createLinearGradient(x1,y1,x2,y2) |
创建一个线性渐变。起始坐标为 x1,y1,结束坐标为 x2,y2。 |
createRadialGradient(x1,y1,r1,x2,y2,r2) |
创建一个放射状渐变。圆圈的起始坐标是 x1,y1,半径为 r1。圆圈的结束坐标为 x2,y2,半径为 r2。 |
addColorStop(offset, color) |
向一个渐变添加一个颜色停止。颜色停止(color stop) 是渐变中颜色更改发生的位置。offset 必须介于 0 到 1 之间。 |
fillStyle |
设置用于填充一个区域的颜色 — 例如,fillStyle='rgb(255,0,0)'. |
strokeStyle |
设置用于绘制一根直线的颜色 — 例如,fillStyle='rgb(255,0,0)'. |
fillRect(x,y,w,h) |
填充一个定位于 x 和 y,宽度和高度分别为 w 和 h 的矩形。 |
strokeRect(x,y,w,h) |
绘制一个定位于 x 和 y,宽度和高度分别为 w 和 h 的矩形的轮廓。 |
moveTo(x,y) |
将绘图位置移动到坐标 x,y。 |
lineTo(x,y) |
从绘图方法结束的最后位置到 x,y 绘制一条直线。 |
下面为实现的canvas箭头源码:
drawarrow.js文件:
//polygonVertex存储模式:
//polygonVertex[0,1]=beginPoint;
//polygonVertex[2,3]=polygonVertex[triangle]右边坐标点
//polygonVertex[4,5]=三角形右边坐标
//polygonVertex[6,7]=三角形顶点坐标   stopPoint
//polygonVertex[8,9]=三角形左边坐标
//polygonVertex[10,11]=polygonVertex[triangle]左边坐标点

$(document).ready(function() {
   var beginPoint = {},
       stopPoint = {},
   polygonVertex = [],
   CONST = {
       edgeLen: 50,
       angle: 25
   };
   //封装的作图对象
   var Plot = {

       angle: "",

       //在CONST中定义的edgeLen以及angle参数
       //短距离画箭头的时候会出现箭头头部过大,修改:
       dynArrowSize: function() {
           var x = stopPoint.x - beginPoint.x,
               y = stopPoint.y - beginPoint.y,
               length = Math.sqrt(Math.pow(x, 2) + Math.pow(y, 2));
           if (length < 250) {
               CONST.edgeLen = CONST.edgeLen/2;
               CONST.angle = CONST.angle/2;
           }
           else if(length<500){
               CONST.edgeLen=CONST.edgeLen*length/500;
               CONST.angle=CONST.angle*length/500;
           }
           // console.log(length);
       },

       //getRadian 返回以起点与X轴之间的夹角角度值
       getRadian: function(beginPoint, stopPoint) {
           Plot.angle = Math.atan2(stopPoint.y - beginPoint.y, stopPoint.x - beginPoint.x) / Math.PI * 180;
           console.log(Plot.angle);
           paraDef(50,25);
           Plot.dynArrowSize();
       },

       ///获得箭头底边两个点
       arrowCoord: function(beginPoint, stopPoint) {
           polygonVertex[0] = beginPoint.x;
           polygonVertex[1] = beginPoint.y;
           polygonVertex[6] = stopPoint.x;
           polygonVertex[7] = stopPoint.y;
           Plot.getRadian(beginPoint, stopPoint);
           polygonVertex[8] = stopPoint.x - CONST.edgeLen * Math.cos(Math.PI / 180 * (Plot.angle + CONST.angle));
           polygonVertex[9] = stopPoint.y - CONST.edgeLen * Math.sin(Math.PI / 180 * (Plot.angle + CONST.angle));
           polygonVertex[4] = stopPoint.x - CONST.edgeLen * Math.cos(Math.PI / 180 * (Plot.angle - CONST.angle));
           polygonVertex[5] = stopPoint.y - CONST.edgeLen * Math.sin(Math.PI / 180 * (Plot.angle - CONST.angle));
       },

       //获取另两个底边侧面点
       sideCoord: function() {
           var midpoint = {};
           // midpoint.x = polygonVertex[6] - (CONST.edgeLen * Math.cos(Plot.angle * Math.PI / 180));
           // midpoint.y = polygonVertex[7] - (CONST.edgeLen * Math.sin(Plot.angle * Math.PI / 180));
           midpoint.x=(polygonVertex[4]+polygonVertex[8])/2;
           midpoint.y=(polygonVertex[5]+polygonVertex[9])/2;
           polygonVertex[2] = (polygonVertex[4] + midpoint.x) / 2;
           polygonVertex[3] = (polygonVertex[5] + midpoint.y) / 2;
           polygonVertex[10] = (polygonVertex[8] + midpoint.x) / 2;
           polygonVertex[11] = (polygonVertex[9] + midpoint.y) / 2;
       },

       //画箭头
       drawArrow: function() {
           var ctx;
           ctx = $(".drawArrow")[0].getContext('2d');
           ctx.fillStyle = "red";
           ctx.beginPath();
           ctx.moveTo(polygonVertex[0], polygonVertex[1]);
           ctx.lineTo(polygonVertex[2], polygonVertex[3]);
           ctx.lineTo(polygonVertex[4], polygonVertex[5]);
           ctx.lineTo(polygonVertex[6], polygonVertex[7]);
           ctx.lineTo(polygonVertex[8], polygonVertex[9]);
           ctx.lineTo(polygonVertex[10], polygonVertex[11]);
           // ctx.lineTo(polygonVertex[0], polygonVertex[1]);
           ctx.closePath();
           ctx.fill();
       }
   };

   //记录起点beginPoint
   $(".drawArrow").mousedown(function(e) {
       beginPoint.x = e.pageX;
       beginPoint.y = e.pageY;
       // alert(beginPoint.x+"+"+beginPoint.y);
   });

   //记录终点stopPoint,绘图
   $(".drawArrow").mouseup(function(e) {
       stopPoint.x = e.pageX;
       stopPoint.y = e.pageY;
       // alert(stopPoint.x+"+"+stopPoint.y);
       Plot.arrowCoord(beginPoint, stopPoint);
       Plot.sideCoord();
       Plot.drawArrow();
   });

   //自定义参数
   function paraDef(edgeLen, angle) {
       CONST.edgeLen = edgeLen;
       CONST.angle = angle;
   }

   // $(".para-def").click(function() {
   //     var edgeLen,
   //         angle;
   //     edgeLen = parseInt($(".edge-len").val());
   //     angle = parseInt($(".angle").val());
   //     paraDef(edgeLen, angle);
   // });

});
HTML文件:
<html>

<head>
   <script type="text/javascript" src="jquery-2.0.3.min.js"></script>
   <script type="text/javascript" src="drawarrow.js"></script>
   <!-- <link rel="stylesheet" type="text/css" href="canvasArrow.css"> -->
   <meta charset="utf-8" name="canvasArrow">
</head>
<style>
.drawArrow {

}
</style>

<body>
   <!-- <h2>Cavas箭头测试</h2> -->
   <canvas id="arrow" class="drawArrow" width="1400" height="600">
   </canvas>
   </br>
   <label>EdgeLength
       <input type="text" class="edge-len"></input>
   </label>
   <label>Angle
       <input type="text" class="angle"></input>
   </label>
   <button class="para-def">定义参数</button>
</body>

</html>
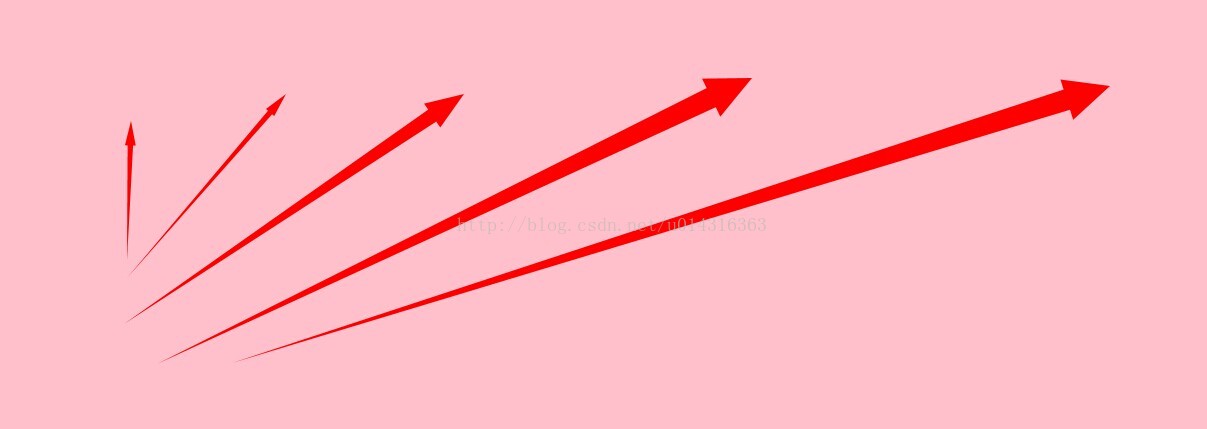
效果图: