解决拟合与过拟合问题的方法:
一、网络层数选择
代码如下:
 1 # encoding: utf-8
 2
 3 import tensorflow as tf
 4 import numpy as np
 5 import seaborn as sns
 6 import os
 7 import matplotlib.pyplot as plt
 8 from sklearn.datasets import make_moons
 9 from sklearn.model_selection import train_test_split
10 from tensorflow.keras import layers, Sequential, optimizers, losses, metrics
11 from tensorflow.keras.layers import Dense
12
13 N_SAMPLES = 1000  # 采样点数
14 N_Epochs = 300
15 TEST_SIZE = 0.3  # 测试数量比率
16 OUTPUT_DIR = r'G:2020python'
17 if not os.path.exists(OUTPUT_DIR):
18     os.mkdir(OUTPUT_DIR)
19
20 # 产生一个简单的样本数据集,半环形图,类似的有make_circles,环形数据
21 X, y = make_moons(n_samples=N_SAMPLES, noise=0.25, random_state=100)  # (1000, 2),(1000, 1)
22 # 将矩阵随机划分训练集和测试集 (700,2),(300,2),(700,1),(300,1)
23 X_train, X_test, y_train, y_test = train_test_split(X, y, test_size=TEST_SIZE, random_state=42)
24 print(X.shape, y.shape)
25
26
27 def make_plot(X, y, plot_name, file_name, XX=None, YY=None, preds=None):
28     plt.figure()
29     axes = plt.gca()
30     x_min = X[:, 0].min() - 1
31     x_max = X[:, 0].max() + 1
32     y_min = X[:, 1].min() - 1
33     y_max = X[:, 1].max() + 1
34     axes.set_xlim([x_min, x_max])
35     axes.set_ylim([y_min, y_max])
36     axes.set(xlabel="$x_l$", ylabel="$x_2$")
37
38     # 根据网络输出绘制预测曲面
39     # markers = ['o' if i == 1 else 's' for i in y.ravel()]
40     # plt.scatter(X[:, 0], X[:, 1], c=y.ravel(), s=20, cmap=plt.cm.Spectral, edgecolors='none', m=markers)
41     if XX is None and YY is None and preds is None:
42         yr = y.ravel()
43         for step in range(X[:, 0].size):
44             if yr[step] == 1:
45                 plt.scatter(X[step, 0], X[step, 1], c='b', s=20, cmap=plt.cm.Spectral, edgecolors='none', marker='o')
46             else:
47                 plt.scatter(X[step, 0], X[step, 1], c='r', s=20, cmap=plt.cm.Spectral, edgecolors='none', marker='s')
48         plt.savefig(OUTPUT_DIR+'/'+file_name)
49         # plt.show()
50     else:
51         plt.contour(XX, YY, preds, cmap=plt.cm.autumn, alpha=0.8)
52         plt.scatter(X[:, 0], X[:, 1], c=y, s=20, cmap=plt.cm.autumn, edgecolors='k')
53         plt.rcParams['font.sans-serif'] = ['SimHei']  # 解决plt.title乱码的问题
54         plt.rcParams['axes.unicode_minus'] = False
55         plt.title(plot_name)
56         plt.savefig(OUTPUT_DIR+'/'+file_name)
57         # plt.show()
58
59
60 make_plot(X, y, None, "exam7_dataset.svg")
61
62 # 创建网络 5种不同的网络
63 for n in range(5):
64     model = Sequential()  # 创建容器
65     model.add(Dense(8, input_dim=2, activation='relu'))  # 第一层
66     for _ in range(n):
67         model.add(Dense(32, activation='relu'))
68     model.add(Dense(1, activation='sigmoid'))  # 创建末尾一层
69     model.compile(loss='binary_crossentropy', optimizer='adam', metrics=['accuracy'])  # 模型的装配
70     history = model.fit(X_train, y_train, epochs=N_Epochs, verbose=1)
71     # 绘制不同层数的网络决策边界曲线
72     x_min = X[:, 0].min() - 1
73     x_max = X[:, 0].max() + 1
74     y_min = X[:, 1].min() - 1
75     y_max = X[:, 1].max() + 1
76     # XX(477, 600), YY(477, 600)
77     XX, YY = np.meshgrid(np.arange(x_min, x_max, 0.01), np.arange(y_min, y_max, 0.01))  # 创建网格
78     Z = model.predict_classes(np.c_[XX.ravel(), YY.ravel()])  # (286200, 1) [0 or 1]
79     preds = Z.reshape(XX.shape)
80     title = "网络层数({})".format(n)
81     file = "网络容量%f.png" % (2+n*1)
82     make_plot(X_train, y_train, title, file, XX, YY, preds)
5种网络层数的拟合效果如下:


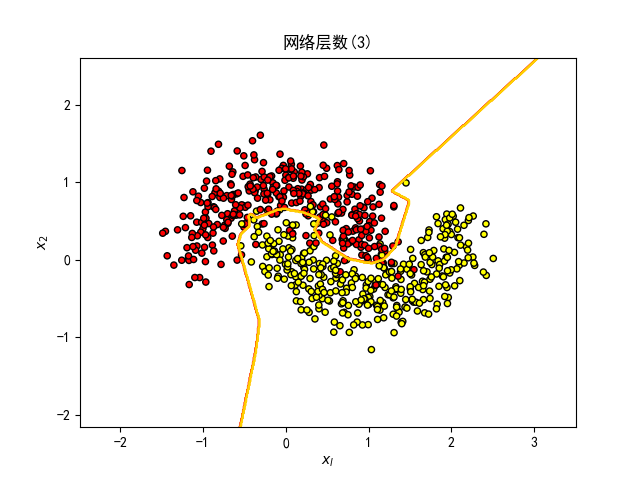
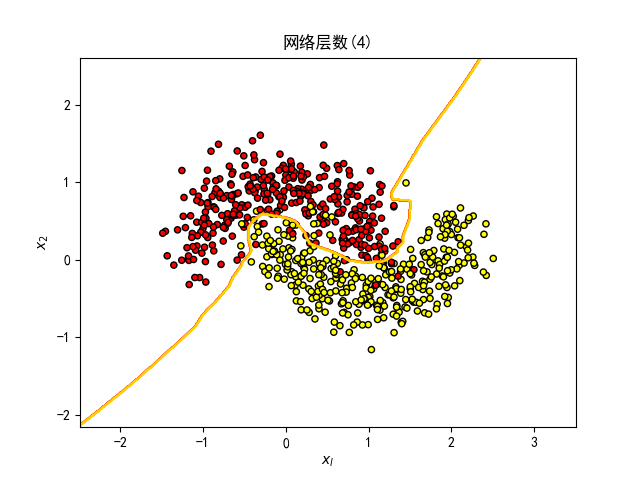
可知网络层数为1,拟合结果较为合理
二、Dropout的影响
代码如下:
 1 # 创建网络 5种不同数量的Dropout层的网络
 2 for n in range(5):
 3     model = Sequential()  # 创建容器
 4     model.add(Dense(8, input_dim=2, activation='relu'))  # 第一层
 5     counter = 0
 6     for _ in range(5):  # 网络层数固定为5
 7         model.add(Dense(64, activation='relu'))
 8         if counter < n:  # 添加n个Dropout层
 9             counter += 1
10             model.add(layers.Dropout(rate=0.5))
11     model.add(Dense(1, activation='sigmoid'))  # 创建末尾一层
12     model.compile(loss='binary_crossentropy', optimizer='adam', metrics=['accuracy'])  # 模型的装配
13     history = model.fit(X_train, y_train, epochs=N_Epochs, verbose=1)
14     # 绘制不同层数的网络决策边界曲线
15     x_min = X[:, 0].min() - 1
16     x_max = X[:, 0].max() + 1
17     y_min = X[:, 1].min() - 1
18     y_max = X[:, 1].max() + 1
19     # XX(477, 600), YY(477, 600)
20     XX, YY = np.meshgrid(np.arange(x_min, x_max, 0.01), np.arange(y_min, y_max, 0.01))  # 创建网格
21     Z = model.predict_classes(np.c_[XX.ravel(), YY.ravel()])  # (286200, 1) [0 or 1]
22     preds = Z.reshape(XX.shape)
23     title = "Dropout({})".format(n)
24     file = "Dropout%f.png" % (n)
25     make_plot(X_train, y_train, title, file, XX, YY, preds)
结果如下图所示:
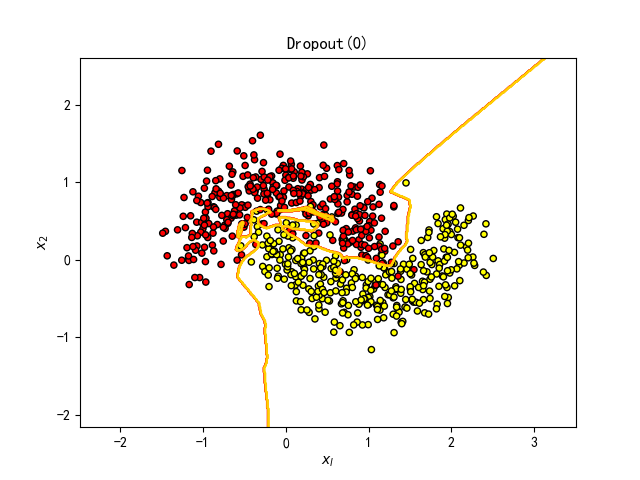

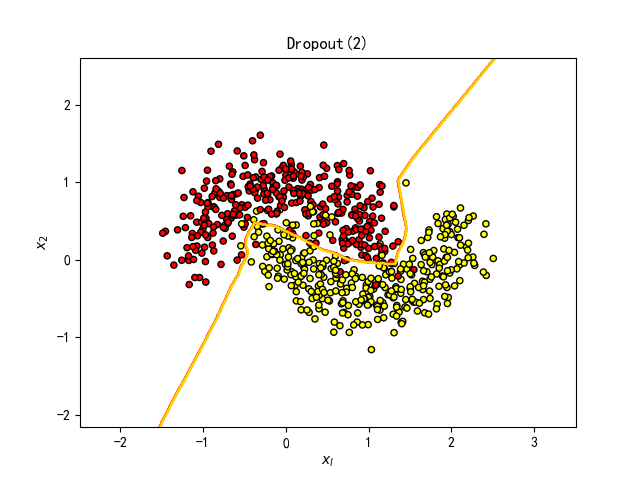
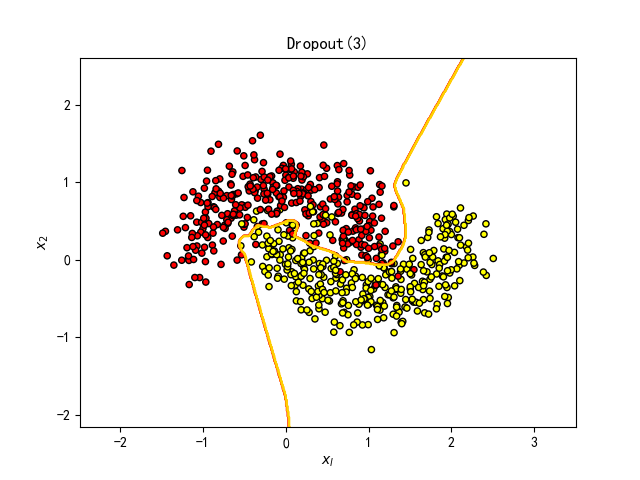

dropout训练断开一定网络连接,避免过拟合,测试时连接,
发现4层Dropout层效果最好。
三、正则化的影响
  1 # encoding: utf-8
  2
  3 import tensorflow as tf
  4 import numpy as np
  5 import seaborn as sns
  6 import os
  7 import matplotlib.pyplot as plt
  8 from sklearn.datasets import make_moons
  9 from sklearn.model_selection import train_test_split
 10 from tensorflow.keras import layers, Sequential, optimizers, losses, metrics, regularizers
 11 from tensorflow.keras.layers import Dense
 12 from pandas import *
 13 from mpl_toolkits.mplot3d import Axes3D
 14
 15 N_SAMPLES = 1000  # 采样点数
 16 # N_Epochs = 300  # 网络层数
 17 # N_Epochs = 500  # dropout
 18 N_Epochs = 300  # 正则化
 19 TEST_SIZE = 0.3  # 测试数量比率
 20 # weight_values = [[1,2,3,4],[2,3,4,1],[3,4,1,2],[4,1,2,3],[1,4,3,2]]  # 测试用
 21 weight_values = []
 22 OUTPUT_DIR = r'G:2020python'
 23 if not os.path.exists(OUTPUT_DIR):
 24     os.mkdir(OUTPUT_DIR)
 25
 26 # 产生一个简单的样本数据集,半环形图,类似的有make_circles,环形数据
 27 X, y = make_moons(n_samples=N_SAMPLES, noise=0.25, random_state=100)  # (1000, 2),(1000, 1)
 28 # 将矩阵随机划分训练集和测试集 (700,2),(300,2),(700,1),(300,1)
 29 X_train, X_test, y_train, y_test = train_test_split(X, y, test_size=TEST_SIZE, random_state=42)
 30 print(X.shape, y.shape)
 31
 32
 33 def make_plot(X, y, plot_name, file_name, XX=None, YY=None, preds=None):
 34     plt.figure()
 35     axes = plt.gca()
 36     x_min = X[:, 0].min() - 1
 37     x_max = X[:, 0].max() + 1
 38     y_min = X[:, 1].min() - 1
 39     y_max = X[:, 1].max() + 1
 40     axes.set_xlim([x_min, x_max])
 41     axes.set_ylim([y_min, y_max])
 42     axes.set(xlabel="$x_l$", ylabel="$x_2$")
 43
 44     # 根据网络输出绘制预测曲面
 45     # markers = ['o' if i == 1 else 's' for i in y.ravel()]
 46     # plt.scatter(X[:, 0], X[:, 1], c=y.ravel(), s=20, cmap=plt.cm.Spectral, edgecolors='none', m=markers)
 47     if XX is None and YY is None and preds is None:
 48         yr = y.ravel()
 49         for step in range(X[:, 0].size):
 50             if yr[step] == 1:
 51                 plt.scatter(X[step, 0], X[step, 1], c='b', s=20, cmap=plt.cm.Spectral, edgecolors='none', marker='o')
 52             else:
 53                 plt.scatter(X[step, 0], X[step, 1], c='r', s=20, cmap=plt.cm.Spectral, edgecolors='none', marker='s')
 54         plt.savefig(OUTPUT_DIR+'/'+file_name)
 55         # plt.show()
 56     else:
 57         plt.contour(XX, YY, preds, cmap=plt.cm.autumn, alpha=0.8)
 58         plt.scatter(X[:, 0], X[:, 1], c=y, s=20, cmap=plt.cm.autumn, edgecolors='k')
 59         plt.rcParams['font.sans-serif'] = ['SimHei']  # 解决plt.title乱码的问题
 60         plt.rcParams['axes.unicode_minus'] = False
 61         plt.title(plot_name)
 62         plt.savefig(OUTPUT_DIR+'/'+file_name)
 63         # plt.show()
 64
 65
 66 # make_plot(X, y, None, "exam7_dataset.svg")
 67
 68
 69 # 正则化影响 5层神经网络
 70 def build_model_with_reglarization(_lambda):
 71     # 创建带正则化的神经网络
 72     model = Sequential()
 73     model.add(Dense(8, input_dim=2, activation='relu'))  # 不带正则化
 74     model.add(Dense(256, activation='relu', kernel_regularizer=regularizers.l2(_lambda)))  # 带L2正则化
 75     model.add(Dense(256, activation='relu', kernel_regularizer=regularizers.l2(_lambda)))  # 带L2正则化
 76     model.add(Dense(256, activation='relu', kernel_regularizer=regularizers.l2(_lambda)))  # 带L2正则化
 77     model.add(Dense(1, activation='sigmoid'))
 78     model.compile(loss='binary_crossentropy', optimizer='adam', metrics=['accuracy'])
 79     return model
 80
 81
 82 def draw_weights_table(weights):
 83     cols_label = ['regularizer lambda', 'W Min', 'W Max', 'W Mean']
 84     fig = plt.figure(figsize=(9, 4))
 85     ax = fig.add_subplot(111, frameon=True, xticks=[], yticks=[])
 86     the_table = plt.table(cellText=weights, colWidths=[0.1]*4, colLabels=cols_label, loc='center', cellLoc='center')
 87     the_table.set_fontsize(35)  # 改变不了字体大小
 88     the_table.scale(2.5, 2.58)
 89     plt.rcParams['font.sans-serif'] = ['SimHei']  # 解决plt.title乱码的问题
 90     plt.rcParams['axes.unicode_minus'] = False
 91     plt.title("权值信息表", fontsize=30)
 92     plt.savefig(OUTPUT_DIR + '/' + "权值信息表.png")
 93     plt.show()
 94
 95
 96 def plot_weights_matrix(model, layer_index, plot_title, file_name, _lambda):
 97     para = model.trainable_variables
 98     weights = para[2*layer_index].numpy()
 99     w_min = weights.min()
100     w_max = weights.max()
101     w_mean = np.mean(weights)
102     values = np.array([_lambda, w_min, w_max, w_mean], dtype=np.float64)
103     values = values.reshape(1, 4)
104     weight_values.append(values)
105     x = np.arange(0, 256, 1)
106     y = np.arange(0, 256, 1)
107     X, Y = np.meshgrid(x, y)
108     fig = plt.figure()
109     ax = Axes3D(fig)
110     ax.plot_surface(X, Y, weights, rstride=1, cstride=1, cmap=plt.cm.jet)
111     plt.rcParams['font.sans-serif'] = ['SimHei']  # 解决plt.title乱码的问题
112     plt.rcParams['axes.unicode_minus'] = False
113     plt.title(plot_title)
114     plt.savefig(OUTPUT_DIR + '/' + file_name)
115     # plt.show()
116
117
118 for _lambda in [1e-5, 1e-3, 1e-1, 0.12, 0.13]:
119     model = build_model_with_reglarization(_lambda)
120     history = model.fit(X_train, y_train, epochs=N_Epochs, verbose=1)
121     # 绘制权值范围
122     layer_index = 2  # 选取第二层的权值
123     plot_title = "正则化-[lambda = {}]".format(str(_lambda))
124     file_name = "正则化-权值%f.png" % _lambda
125     # 绘制网络权值范围图
126     plot_weights_matrix(model, layer_index, plot_title, file_name, _lambda)
127     # 绘制不同层数的网络决策边界曲线
128     x_min = X[:, 0].min() - 1
129     x_max = X[:, 0].max() + 1
130     y_min = X[:, 1].min() - 1
131     y_max = X[:, 1].max() + 1
132     # XX(477, 600), YY(477, 600)
133     XX, YY = np.meshgrid(np.arange(x_min, x_max, 0.01), np.arange(y_min, y_max, 0.01))  # 创建网格
134     Z = model.predict_classes(np.c_[XX.ravel(), YY.ravel()])  # (286200, 1) [0 or 1]
135     preds = Z.reshape(XX.shape)
136     title = "正则化({})".format(_lambda)
137     file = "正则化%f.png" % _lambda
138     make_plot(X_train, y_train, title, file, XX, YY, preds)
139
140 draw_weights_table(weight_values)
正则化结果:


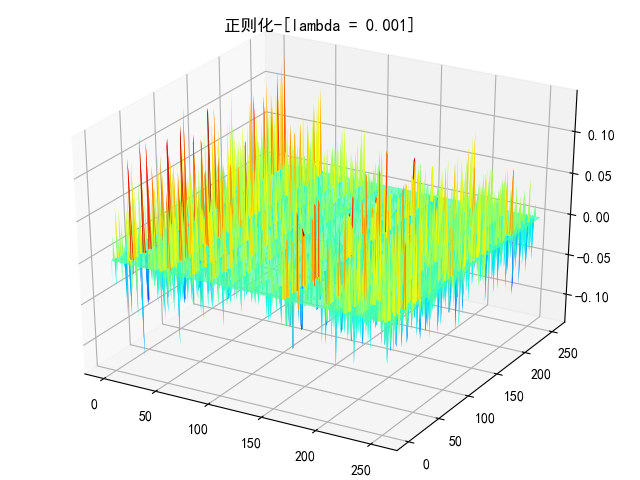

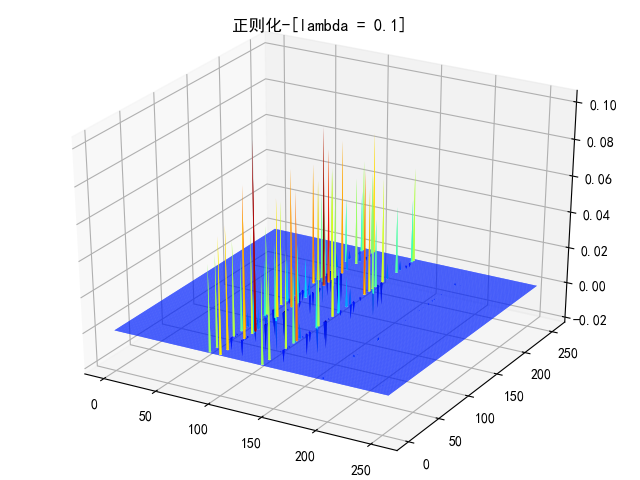
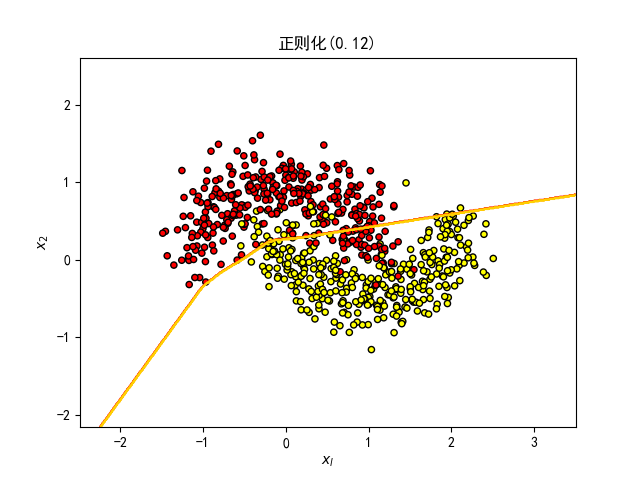
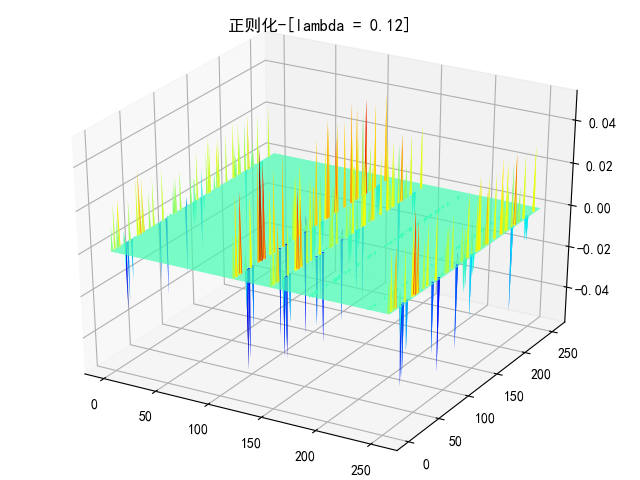


正则化L2的值为0.001适合