上一篇echarts实践-用线分割的点图介绍了echarts的基本操作及用标线分割点图的不同区域,如下为给图表划分区域。
1、series节点下添加属性markArea增加区域
(1)markArea节点下的data由多组区域数据构成,每组长度固定为2的对象分别用来固定左右及上下区间
data: [
                [{
                yAxis: '2.5',//y轴坐标控制
                itemStyle:{
                    color:'#c60c30'
                }
            }, {
                yAxis: '3.5'
            }]
            ,
            [{
                yAxis: '4.5',
                itemStyle:{
                    color:'#ffb400'
                }
            }, {
                yAxis: '6.5'
            }]
(2)可全局控制区域的样式及单独控制每个区域的样式
全局,在data的同一级添加如下代码:
itemStyle: { //全局的
                normal: { color: '#ff3333' }
            }
单独控制:
 [{
                yAxis: '2.5',//y轴坐标控制
                itemStyle:{ //控制当前区域样式
                    color:'#c60c30'
                }
            }, {
                yAxis: '3.5'
            }]
2、示例代码
option = {
    title: {
        text: '标题',
        x: 'center'
    },
    tooltip: {
        trigger: 'axis'
    },
    xAxis: {
        data : ['8/14','8/15','8/16','8/17','8/18','8/19','8/20']
    },
    yAxis: {
        axisLine:{show:false},
        name:'y轴标题',
        position: 'left',//y轴位置
        nameLocation: 'middle', //坐标轴名称显示位置
        type: 'value',
        max:20,//最大值
        nameGap:30//与y轴间距
    },
    series: [{
        itemStyle:{
            normal:{
                color:'#666666'
            }
        },
        symbolSize: 15,//点的大小
        data: [
            [x='8/14', y=3.04],
            [x='8/14', y=9.04],
            ['8/15', 6.95],
            ['8/15', 7.58],
            ['8/15', 8.81],
            ['8/15', 8.33],
            ['8/16', 9.96],
            ['8/17', 7.24],
            ['8/18', 4.26],
            ['8/18', 10.84],
            ['8/20', 4.82],
            ['8/20', 5.68]
        ],
        type: 'scatter',
        markArea: { //标记区域
            itemStyle: { //全局的
                normal: { color: '#ff3333' }
            },
            data: [
                [{
                yAxis: '2.5',//y轴坐标控制
                itemStyle:{
                    color:'#c60c30'
                }
            }, {
                yAxis: '3.5'
            }]
            ,
            [{
                yAxis: '4.5',
                itemStyle:{
                    color:'#ffb400'
                }
            }, {
                yAxis: '6.5'
            }]
            ]
        },
        markLine: {//标线
                symbol: ['none', 'none'],//去掉箭头
                itemStyle: {
                    normal: {
                        lineStyle: { //全局的样式
                            type: 'solid',
                             2
                        }
                        ,label: { show: false, position:'left' } }
                },
                data: [{
                        yAxis: 2.5,
                        itemStyle: {
                            normal: { color: '#c60c30' }
                        }
                },
                {
                        yAxis: 3.5,
                        itemStyle: {
                            normal: { color: '#c60c30' }
                        }
                }
                ,
                {
                        yAxis: 4.5,
                        itemStyle: {
                            normal: { color: '#ffb400' }
                        }
                },
                {
                        yAxis: 6.5,
                        itemStyle: {
                            normal: { color: '#ffb400' }
                        }
                }]
        }
    }

]
};
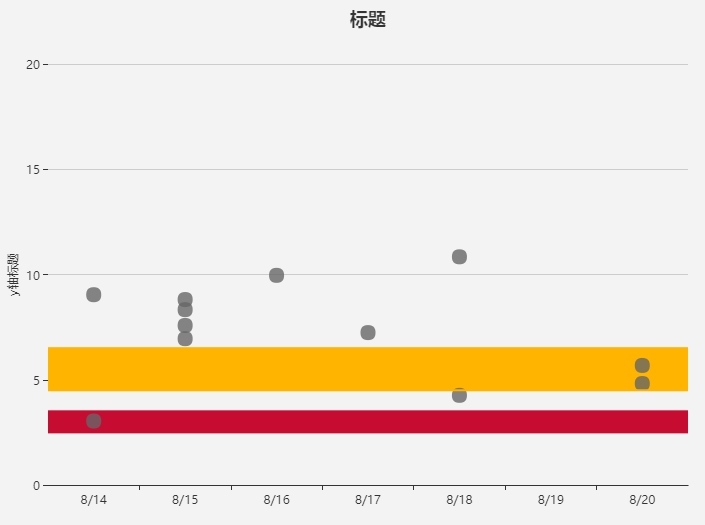
3、效果图