Centos7安装Promethus(普罗米修斯)监控系统完整版
Promethus(普罗米修斯)监控Mysql数据库

教程使用的软件:链接: https://pan.baidu.com/s/1QV4KYZksyIp65UsScioq4Q 提取码: vcej
环境配置
| 服务器 | IP地址 |
| Prometneus服务器 | 192.168.116.129 |
| 被监控服务器(mysql) | 192.168.116.130 |
| grafana服务器 | 192.168.116.131 |
1、什么是Grafana
Grafana是一个开源的度量分析和可视化工具,可以通过将采集的数据分 析,查询,然后进行可视化的展示,并能实现报警。

2、使用Grafana连接Prometheus
① 在grafana服务器上安装grafana
下载地址:https://grafana.com/grafana/download
上传grafana-5.3.4-1.x86_64.rpm
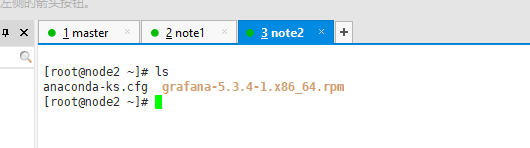
我这里选择的rpm包,下载后直接rpm -ivh安装就OK【失败原因缺少组件,可以yum安装组件】
rpm -ivh /root/Desktop/grafana-5.3.41.x86_64.rpm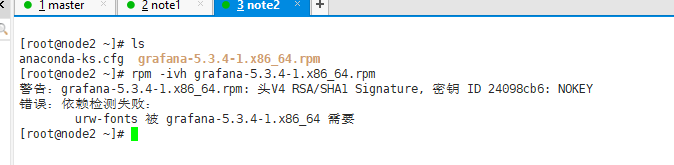
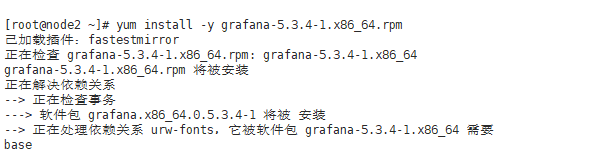
或者第二种方法【yum安装会自动安装缺少的组件的】
yum install -y grafana-5.3.4-1.x86_64.rpm
启动服务
systemctl start grafana-server
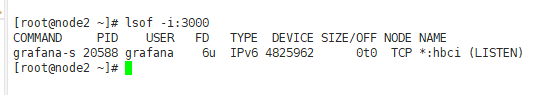
systemctl enable grafana-server 确认端口(3000)
lsof -i:3000
② 通过浏览器访问 http:// grafana服务器IP:3000就到了登录界面,使用默 认的admin用户,admin密码就可以登陆了

③ 下面我们把prometheus服务器收集的数据做为一个数据源添加到 grafana,让grafana可以得到prometheus的数据。


④ 然后为添加好的数据源做图形显示


⑤ 保存

⑥ 最后在dashboard可以查看到

⑦ 匹配条件显示
