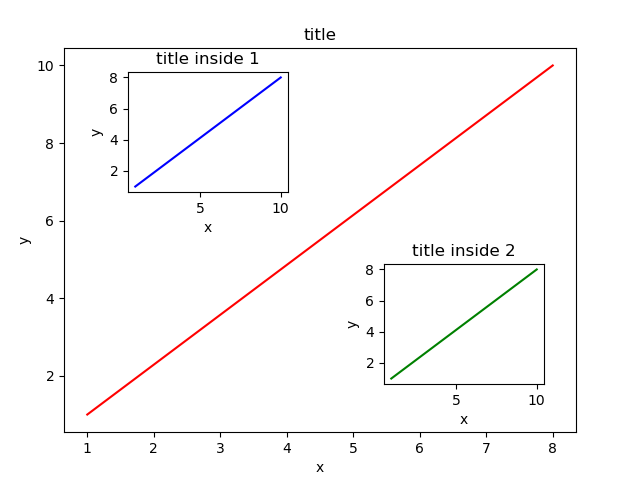
一: fig.add_axes 画图中图
fig = plt.figure()
    x = np.arange(1, 9, 1)
    y = np.linspace(1, 10, 8)
    left, bottom, width, height = 0.1, 0.1, 0.8, 0.8
    ax1 = fig.add_axes([left, bottom, width, height])
    ax1.plot(x, y, 'r')
    ax1.set_xlabel('x')
    ax1.set_ylabel('y')
    ax1.set_title('title')

    left, bottom, width, height = 0.2, 0.6, 0.25, 0.25
    ax2 = fig.add_axes([left, bottom, width, height])
    ax2.plot(y, x, 'b')
    ax2.set_xlabel('x')
    ax2.set_ylabel('y')
    ax2.set_title('title inside 1')

    left, bottom, width, height = 0.6, 0.2, 0.25, 0.25
    ax3 = fig.add_axes([left, bottom, width, height])
    ax3.plot(y, x, 'g')
    ax3.set_xlabel('x')
    ax3.set_ylabel('y')
    ax3.set_title('title inside 2')
    plt.savefig('./image_dir/tu1.png')
    plt.tight_layout()
    plt.show()
二:次坐标轴
1
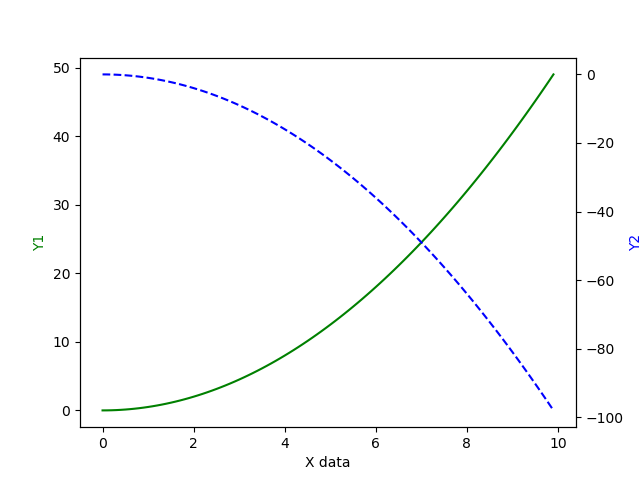
x = np.arange(0, 10, 0.1)
 2     y1 = 0.5*x**2
 3     y2 = -1*x**2
 4     fig, ax1 = plt.subplots()
 5     ax2 = ax1.twinx()
 6     ax1.plot(x, y1, 'g-')
 7     ax2.plot(x, y2, 'b--')
 8     ax1.set_xlabel('X data')
 9     ax1.set_ylabel('Y1', color='g')
10     ax2.set_ylabel('Y2', color='b')
11     plt.savefig('./image_dir/xy.png')
12     plt.tight_layout()
13     plt.show()