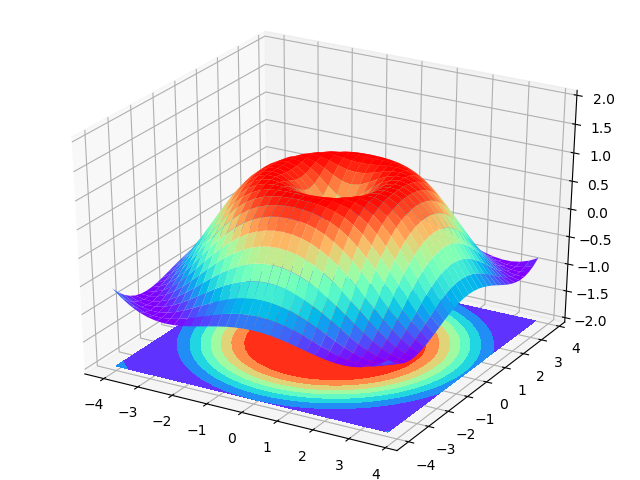
import numpy as np
import matplotlib.pyplot as plt
from mpl_toolkits.mplot3d import Axes3D
fig = plt.figure()
    ax = Axes3D(fig)
    x = np.arange(-4, 4, 0.25)
    print(x)
    y = np.arange(-4, 4, 0.25)
    x, y = np.meshgrid(x, y)
    # np.sqrt(x) : 计算数组各元素的平方根
    R = np.sqrt(x**2 + y**2)
    # height value
    z = np.sin(R)
    ax.plot_surface(x, y, z, rstride=1, cstride=1, cmap='rainbow')
    # zdir 表示向那个轴投影
    ax.contourf(x, y, z, zdir='z', offset=-2, cmap='rainbow')
    # 设置等高线的高度
    ax.set_zlim(-2, 2)
    plt.savefig('./image_dir/3d.png')
    plt.show()