1、 安装前期要求:
安装要求:Linux + JDK8.0以上版本,具体步骤略。
2、 安装步骤:
1) 安装GeoServer
get https://sourceforge.net/projects/geoserver/files/GeoServer/2.17.5/geoserver-2.17.5-war.zip/download
GeoServer有两个版本:War版本、二进制执行版本。其中War版本可以通过安装Tomcat后将War包放在WEB_INFO目录下即可。建议下载二进制版本。
2)安装GeoServer矢量瓦片切片插件
get https://sourceforge.net/projects/geoserver/files/GeoServer/2.17.5/extensions/geoserver-2.17.5-vectortiles-plugin.zip/download
下载后将文件解压后将其中的jar包放在geoserver-2.17.5/webapps/geoserver/WEB-INF/lib目录下。
3) 启动GeoServer服务
geoserver-2.15.1/bin/start.sh &
4) 下载mapbox-gl
mapbox-gl版本建议使用MacOS系统下载安装,也可以通过Ubuntu系统下载安装。
3 发布地图服务:
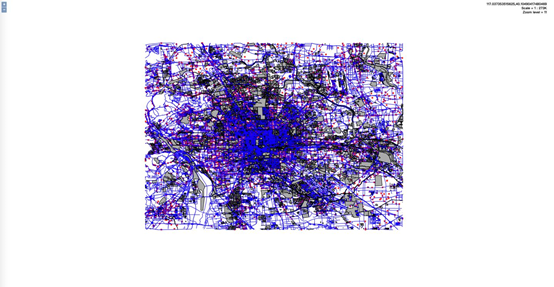
1) 准备shp文件
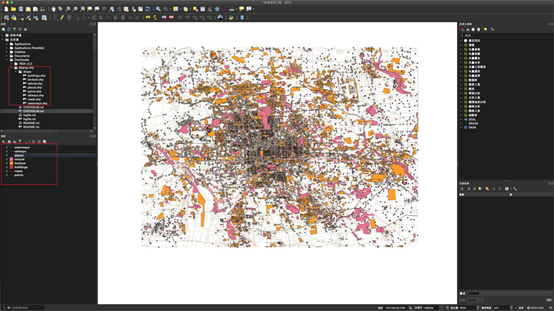
地图渲染效果如上(在QGIS上打开文件)
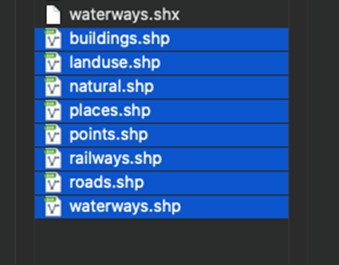
准备的 shp 文件包含8个Shp文件。如上图所示。
2) 部署数据文件,进行数据切片
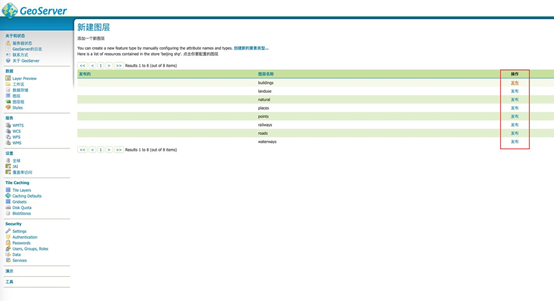
a) 新建一个工作区
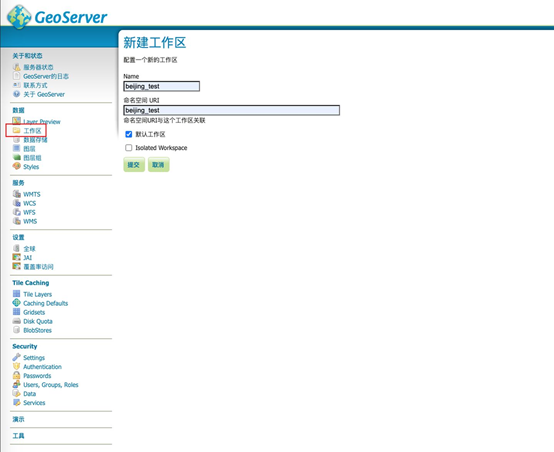
选择新建工作区,如上图所示,输入工作区名称和工作区命名空间URI,选择默认工作区,点击提交按钮。
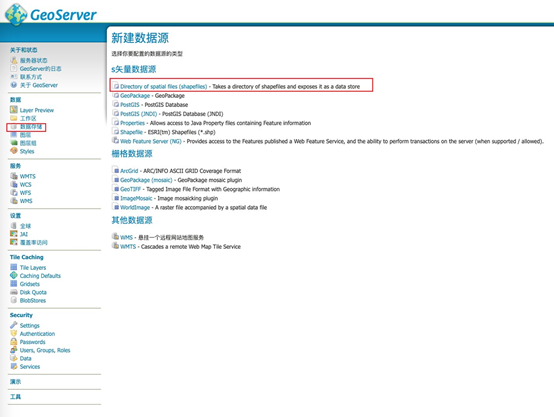
b) 新建数据存储
c) 每个要素发布
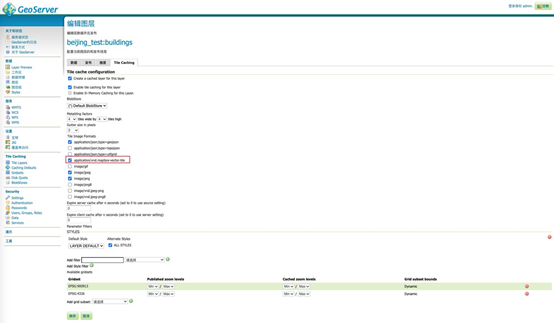
记得在 Tile Caching 中勾选 application/vnd.mapbox-vector-tile
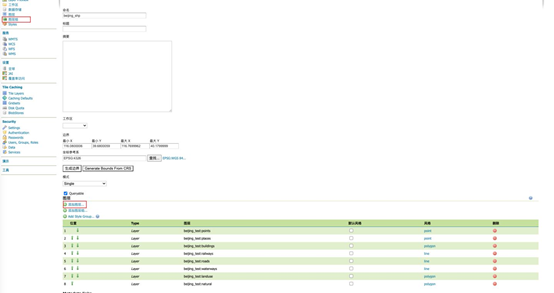
d) 新建图层组
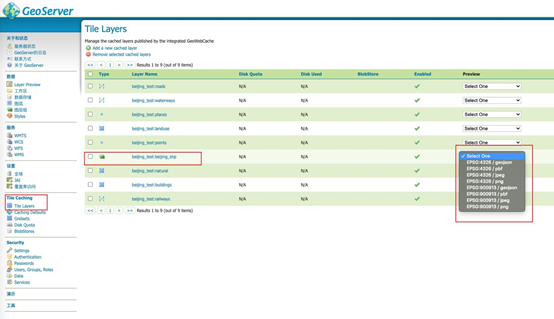
e) 可以通过Layer Preview看到发布效果
4、 使用mapbox-gl渲染数据:
为了方便, 使用 vue-cli 快速生成一个项目,并安装 mapbox-gl:
yarn add mapbox-gl
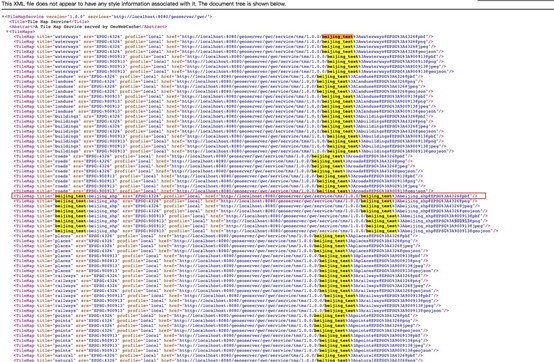
首先需要获得 GeoServer 部署的 tile 的地址,在 GeoServer 首页中,可以看到 tms 服务,点之后,可以看到一个 xml 页面:
选择
http://localhost:8080/geoserver/gwc/service/tms/1.0.0/beijing_test%3Abeijing_shp@EPSG%3A900913@pbf
作为瓦片服务的地址,并拼接成
http://localhost:8080/geoserver/gwc/service/tms/1.0.0/beijing_test%3Abeijing_shp@EPSG%3A900913@pbf/{z}/{x}/{y}.pbf
作为 mapbox tiles的地址;由于请求会跨域,所以需要使用nginx 转发请求。初始化 mapbox 代码:
const map = new mapboxgl.Map({
      container: "app",
      center: [116.391229827904, 39.907092084593216], // starting position [lng, lat]
      zoom: 16, // starting zoom
      style: {
        version: 8,
        glyphs: "/cdn/map/fonts/{fontstack}/{range}.pbf",
        sources: {
          beijingSource: {
            type: "vector",
            scheme: "tms",
            tiles: [
              "http://localhost/geoserver/gwc/service/tms/1.0.0/beijing_test%3Abeijing_shp@EPSG%3A900913@pbf/{z}/{x}/{y}.pbf", // 使用 nginx 转发
            ],
          },
        },
        layers: [],
      },
    });
初始化完代码之后,地图上还不会显示地图要素,需要添加一个 layer,layer的名称就是下载的 .shp 文件的名称,或者说是地图数据图层的名称,比如图层名称为 beijingtest:building,在mapbox的 "source_layer" 配置中的值就是 "building"。
接下来添加一个 building layer:
map.on("load", function () {
    map.addLayer({
        id: "railways",
        source: "beijingSource",
        "source-layer": "railways",
        type: "line",
        //   minzoom: 12,
        paint: {
          "line-color": "#f2934a",
          "line-opacity": 1,
          "line-width": 3,
        },
      });
}
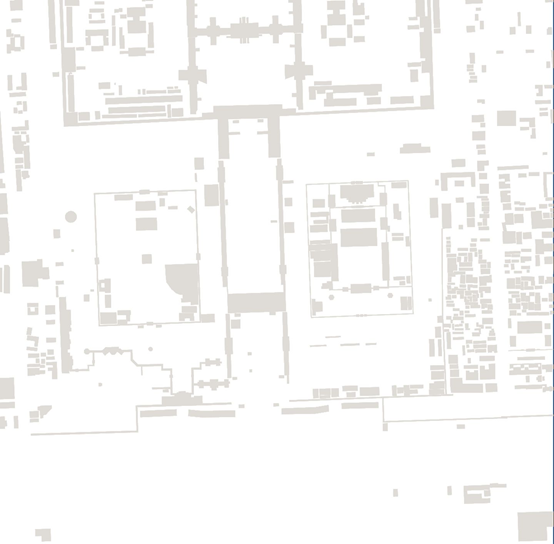
在页面中,可以看到,建筑数据已经被渲染出来了。对于 addLayer 参数的配置,可以查看 mapbox 样式规范。
接着,分别配置 "natural", "landuse"等另外的图层,就能渲染出整个地图了:
最后,还缺少文字,我们使用 QGIS 查看一下数据属性,发现文字存储在points,places,roads 数据的 "name" 属性中:
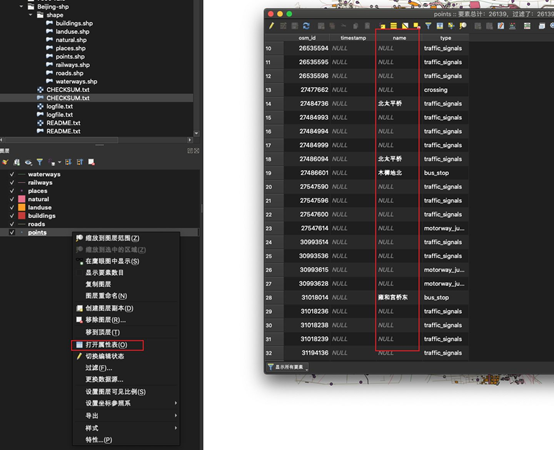
points属性查看
比如,要渲染 roads name,可进行如下配置,注意在 layout 中指定 "text-field" 即为要渲染的文字字段名称:
map.addLayer({
        id: "roads-name",
        source: "beijingSource",
        "source-layer": "roads",
        type: "symbol",
        layout: {
          "text-field": "{name}",
          "text-transform": "uppercase",
          "text-font": ["Microsoft YaHei Regular"],
          "text-padding": 5,
          "text-keep-upright": false,
          "text-rotation-alignment": "map",
          "symbol-placement": "line-center",
          "text-pitch-alignment": "viewport",
          "text-size": 12,
        },
        paint: {
          "text-halo-color": "rgb(200, 200, 200)",
          "text-halo-width": 1,
          "text-color": "rgb(0, 0, 0)",
          "text-halo-blur": 0.5,
        },
        interactive: true,
      });
现在看起来比较完美了,不足的是地图背景色无法进行配置。我们可以添加一个 geojson 数据源,代表着北京数据的 polygon,给这个数据进行着色,就能配置出背景色了。
map.addSource("bg", {
        type: "geojson",
        data: {
          type: "FeatureCollection",
          features: [
            {
              type: "Feature",
              properties: {},
              geometry: {
                type: "Polygon",
                coordinates: [
                  [
                    [115.13671875, 39.2492708462234],
                    [117.57568359374999, 39.2492708462234],
                    [117.57568359374999, 41.08763212467916],
                    [115.13671875, 41.08763212467916],
                    [115.13671875, 39.2492708462234],
                  ],
                ],
              },
            },
          ],
        },
      });

      //------------------ bg
      map.addLayer({
        id: "bg",
        source: "bg",
        type: "fill",
        paint: {
          "fill-color": "#efe9e1",
        },
      });
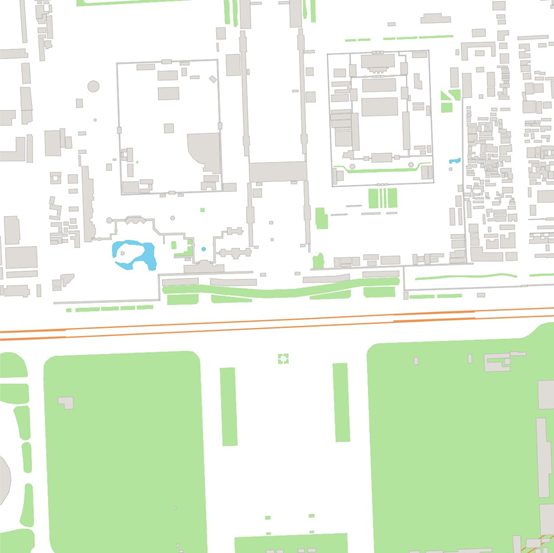
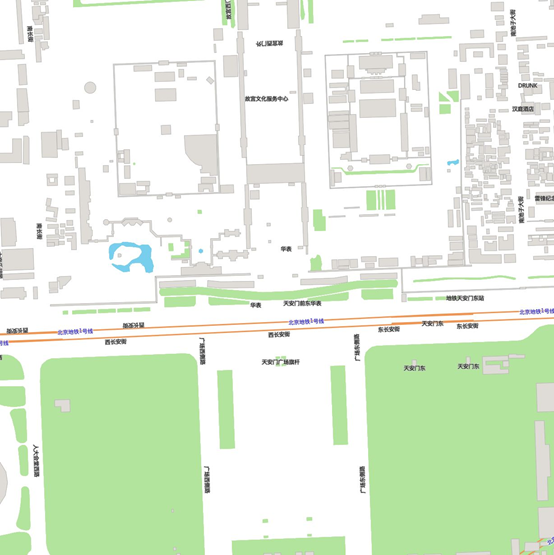
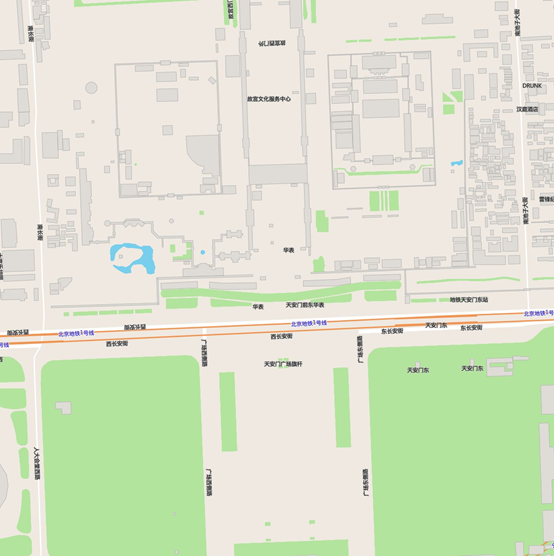
最终效果图:
总结
要渲染出流畅、漂亮的地图,需要控制好数据需要渲染层级、对不同层级的数据进行抽稀以及读懂 mapbox 样式规范,有了这些就行作出媲美mapbox官方的离线地图了。