项目中初次使用echarts2,感觉好多配置项不知道是啥,在文档里也不知从何找起,在此总结一下(仅做向导用,不会太详细,大家可根据属性到官方文档查找),以便今后查看,同时希望帮到echarts新手,大神勿喷,后期会根据个人需求不断完善
官方文档链接:http://echarts.baidu.com/echarts2/doc
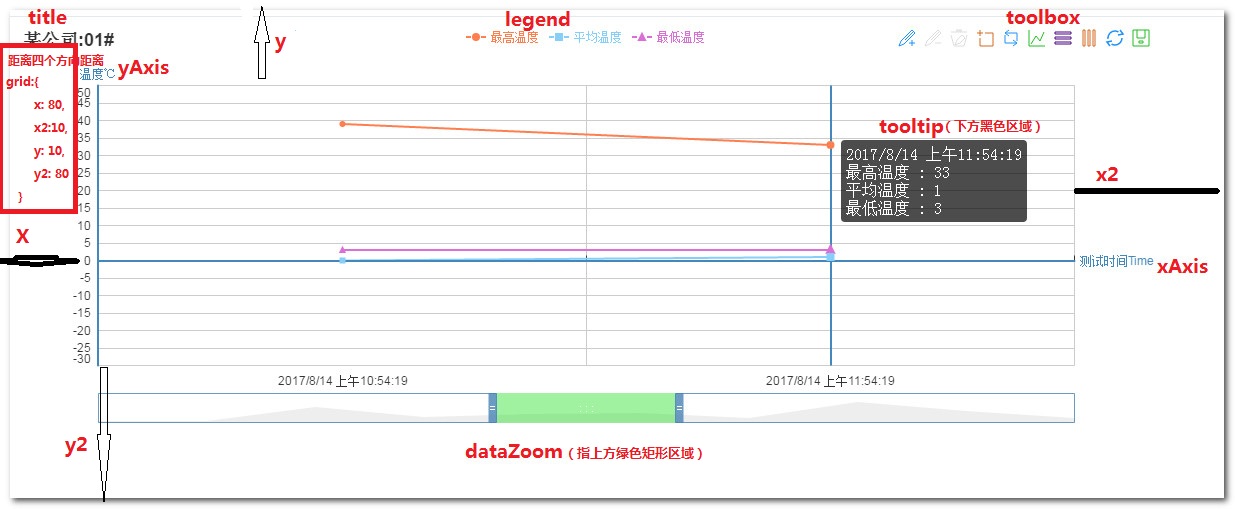
toolbox
借用下官方图
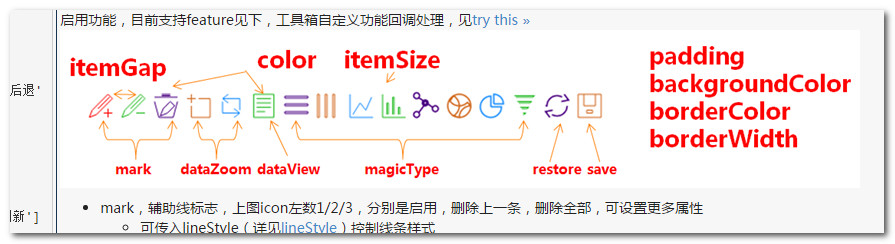
 1  toolbox: {
 2             show : true,
 3             x: 'right',  //显示位置,有左中右
 4             color: ['#1e90ff','#22bb22','#f0f','#d2691e'], //循环颜色,可自定义
 5             feature : {
 6                 mark : {show: false},
 7                 dataView : {show: false, readOnly: false},
 8                 magicType : {show: true, type: ['stack', 'tiled']},
 9                 restore : {show: true},
10                 saveAsImage : {show: false}
11             }
12         },
自定义折线及图例颜色
 1  series : [
 2             {
 3                 name:'流量',
 4                 type:'bar',
 5                 // barWidth : 25,
 6                 data:[120, 132, 101, 134, 90, 230, 210,132, 101, 134],
 7                 itemStyle:{
 8                   normal:{color:'#0ff'}  //自定义颜色(折线和图例)
 9                 }
10             },
11             {
12                 name:'短信',
13                 type:'bar',
14                 barWidth : 25,
15                 data:[620, 732, 701, 734, 1090, 1130, 1120,132, 101, 134],
16                 itemStyle:{
17                   normal:{color:'#F748C4'} //自定义颜色(折线和图例)
18                 }
19             }
20         ]
加过渡动画
官方默认 可选为:'spin' | 'bar' | 'ring' | 'whirling' | 'dynamicLine' | 'bubble',支持外部装载
 1 // 图表
 2     var myChart = echarts.init(document.getElementById('main'));
 3     // 过渡
 4     var loadingTicket;
 5     myChart.showLoading({
 6         text : 'dynamicLine Loading ...',
 7         effect : 'dynamicLine', //'spin' | 'bar' | 'ring' | 'whirling' | 'dynamicLine' | 'bubble'
 8         textStyle : {
 9             fontSize : 20
10         }
11     });
12     var option = {};
13     clearTimeout(loadingTicket);
14     loadingTicket = setTimeout(function (){
15         myChart.hideLoading();
16         myChart.setOption(option);
17     },1600);
18     // --------------------图表响应式
19     $(window).resize(function(){
20         myChart.resize();
21     });
x轴坐标显示间隔
 1 xAxis: [
 2      {
 3        type: 'category',
 4        name:'测试时间Time',
 5        boundaryGap: false, //x轴两端是否留空,默认留空(true)
 6        axisLabel:{
 7           interval:1      //0:表示全部显示不间隔;auto:表示自动根据刻度个数和宽度自动设置间隔个数
 8        }
 9      }
10  ]