原文:
https://blog.csdn.net/samanthamao/article/details/110683533
代码
import numpy as np
import math
import matplotlib.pyplot as plt
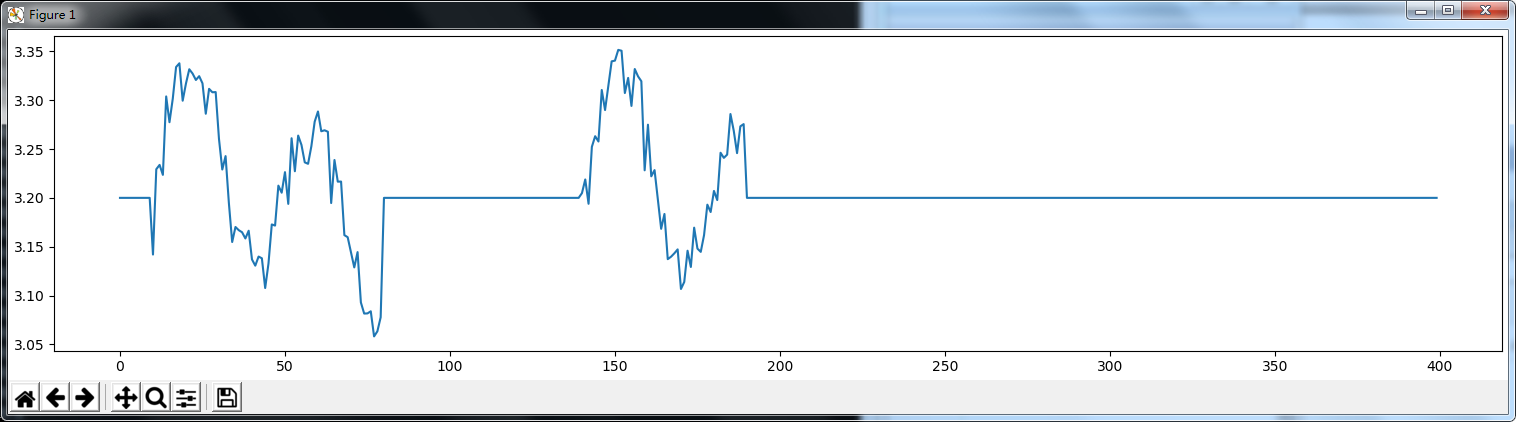
#python在指定的时间段生成周期性波动的数据:
#周期性
long=400 # 400个步长,x轴的总长度
base=3.2 # 均值
ybase = np.zeros((1,long))[0] + base # 所有数据
period_multiply = 0.1 # 越大,幅值越大,调整波峰
period_frequency = 20 # 越大,周期越大
seg = [(10, 80), (140, 190)]
for (i,j) in seg: # 一组一组数据的遍历,现在这里是遍历两组数据:(10, 80) 和 (140, 190)
print(seg)
n = j-i # n=40,40 50
x = np.arange(n)
season1 = 1 * np.array([math.sin(i/period_frequency*math.pi) for i in x])
season2 = 0.5 * np.array([math.sin(i*0.5/period_frequency*math.pi) for i in x])
noise = np.random.normal(0, 0.2, len(x))
y = season1 + season2 + noise # 可以叠加多尺度周期和噪声
# y = season1+season2
for idx in range(i, j): # 遍历具体的点
print(idx, period_multiply)
ybase[idx] = ybase[idx] + y[idx-i] * period_multiply
plt.figure(figsize=(15, 3.5))
plt.plot(ybase)
plt.tight_layout(pad=0.4, w_pad=0.5, h_pad=2.0)
plt.show()
效果