一、前言
图表显示:用的HTML来显示,js插件用的echarts,百度的
数据处理:excel转换为json数据,方便echarts使用,这里用的python
mark:
由于熟悉的工具不一样,就用到了两个工具来实现,
其实python就可以完成所有功能了,还可以直接生成exe文件直接分享出来,主要是不太熟。。。
二、Python代码
#-*- encoding:utf-8 -*-
import xlrd
import json
import requests
from datetime import datetime
from xlrd import xldate_as_tuple


# 原文
# https://www.cnblogs.com/zjx012/p/11615719.html
# https://blog.csdn.net/liulina603/article/details/79171097/


def openWorkbook(excel_name):
    workbook = xlrd.open_workbook(excel_name+'.xlsx')# 读取excel表的数据
    sheet = workbook.sheet_by_index(0)# 选取需要读取数据的那一页
    rows = sheet.nrows# 获得行数
    cols = sheet.ncols# 获得列数
    p = []# 创建一个数组用来存储excel中的数据
    for i in range(1, rows):# 遍历行
        d = {}
        for j in range(0, cols):# 遍历列
            ctype = sheet.cell(i, j).ctype# 单元格的数据类型
            cell = sheet.cell_value(i, j)
            # 单元格的 数据类型 判断
            if ctype == 2 and cell % 1 == 0:# int类型
                cell = int(cell)
            elif ctype == 3:# datetime类型
                date = datetime(*xldate_as_tuple(cell, 0))
                #cell = date.strftime('%Y/%m/%d %H:%M:%S')
                cell = date.strftime('%Y/%m/%d')
            elif ctype == 4:# bool类型
                cell = True if cell == 1 else False

            q = '%s' % sheet.cell(0, j).value# 列名
            #d[q] = sheet.cell(i, j).value
            d[q] = cell

        ap = []
        for k, v in d.items():
            if isinstance(v, float):# excel中的值默认是float,需要进行判断处理,通过'"%s":%d','"%s":"%s"'格式化数组
                ap.append('"%s":%d' % (k, v))
            else:
                ap.append('"%s":"%s"' % (k, v))
        s = '{%s}' % (','.join(ap))# 继续格式化
        p.append(s)
    t = '[%s]' % (','.join(p))# 格式化
    data=json.dumps(t,ensure_ascii=False)
    with open(excel_name+'.json',"w",encoding='utf-8') as f:
        f.write(t)


openWorkbook('乔薇尔-1-潘多拉Salon')
openWorkbook('乔薇尔-2-TB熊猫眼')
openWorkbook('乔薇尔-3-3店')
openWorkbook('乔薇尔-4-AngelSalon奢品店')
三、HTML代码
<!DOCTYPE html>
<html>
<head>
<meta charset="utf-8" />
<title></title>
</head>
<body>
<div id="main" style=" 1000px;height:600px;"></div>
<script src="http://libs.baidu.com/jquery/2.0.0/jquery.min.js"></script>
<script src="https://lib.baomitu.com/echarts/4.7.0/echarts.min.js"></script>
<script type="text/javascript">
var myChart = echarts.init(document.getElementById('main'));
var option = {
title: {
text: '折线图堆叠'
},
tooltip: {
trigger: 'axis'
},
legend: {
data: ['邮件营销', '联盟广告', '视频广告', '直接访问', '搜索引擎']
},
grid: {
left: '3%',
right: '4%',
bottom: '3%',
containLabel: true
},
toolbox: {
feature: {
saveAsImage: {}
}
},
xAxis: {
type: 'category',
boundaryGap: false,
data: ['周一', '周二', '周三', '周四', '周五', '周六', '周日'],
axisLabel: {// 解决横坐标显示不全
//showMinLabel: true,//显示最小值
//showMaxLabel: true,//显示最大值
interval: 0,
rotate: 40
}
},
yAxis: {
type: 'value'
},
series: [
{
name: '邮件营销',
type: 'line',
stack: '总量',
data: [120, 132, 101, 134, 90, 230, 210]
},
{
name: '联盟广告',
type: 'line',
stack: '总量',
data: [220, 182, 191, 234, 290, 330, 310]
},
{
name: '视频广告',
type: 'line',
stack: '总量',
data: [150, 232, 201, 154, 190, 330, 410]
},
{
name: '直接访问',
type: 'line',
stack: '总量',
data: [320, 332, 301, 334, 390, 330, 320]
},
{
name: '搜索引擎',
type: 'line',
stack: '总量',
data: [820, 932, 901, 934, 1290, 1330, 1320]
}
]
};
var arr = [];
var load_data_num = 0;
// 初始化图表
var initial_char = function () {
var legend_data = [];
arr.forEach(c => {
legend_data.push(c[0]['所属店铺']);
});
var xAxis_data = [];
arr[0].forEach(c => {
xAxis_data.push(c['日期']);
});
var series = [];
var i = 0;
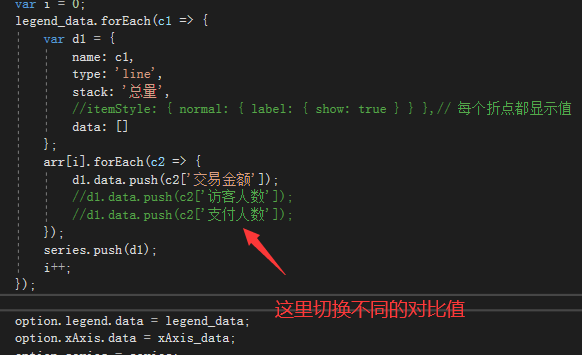
legend_data.forEach(c1 => {
var d1 = {
name: c1,
type: 'line',
stack: '总量',
//itemStyle: { normal: { label: { show: true } } },// 每个折点都显示值
data: []
};
arr[i].forEach(c2 => {
//d1.data.push(c2['交易金额']);
//d1.data.push(c2['访客人数']);
d1.data.push(c2['支付人数']);
});
series.push(d1);
i++;
});
option.legend.data = legend_data;
option.xAxis.data = xAxis_data;
option.series = series;
myChart.setOption(option);
};
// 构造数据
var initial_data = function (data) {
load_data_num++;
arr.push(data.reverse());
if (load_data_num == 4) {
initial_char();
}
};
$.getJSON('乔薇尔-1-潘多拉Salon.json', function (data) { initial_data(data); });
$.getJSON('乔薇尔-2-TB熊猫眼.json', function (data) { initial_data(data);});
$.getJSON('乔薇尔-3-3店.json', function (data) { initial_data(data); });
$.getJSON('乔薇尔-4-AngelSalon奢品店.json', function (data) { initial_data(data); });
</script>
</body>
</html>
四、需要的数据
1、所需的原始excel
是从市场洞察里面导出的,然后保存为excel格式
2、处理后的json数据
3、json数据在HTML项目中的位置

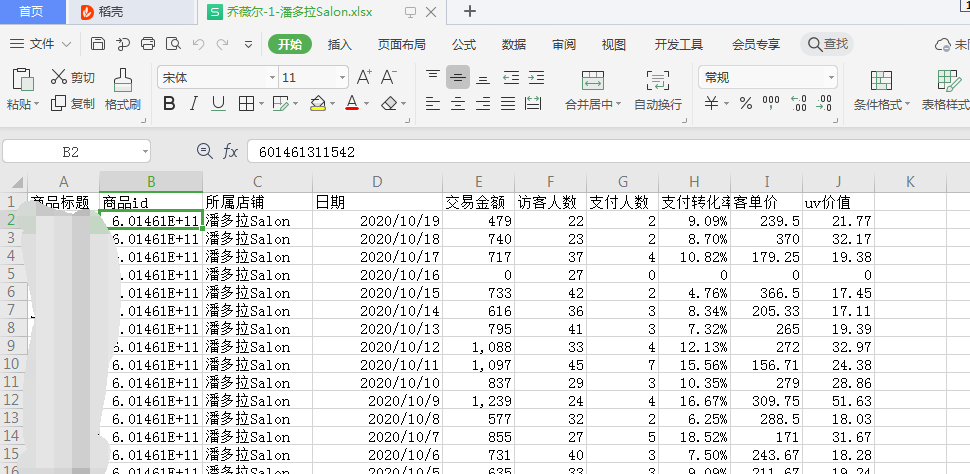
4、excel数据预览
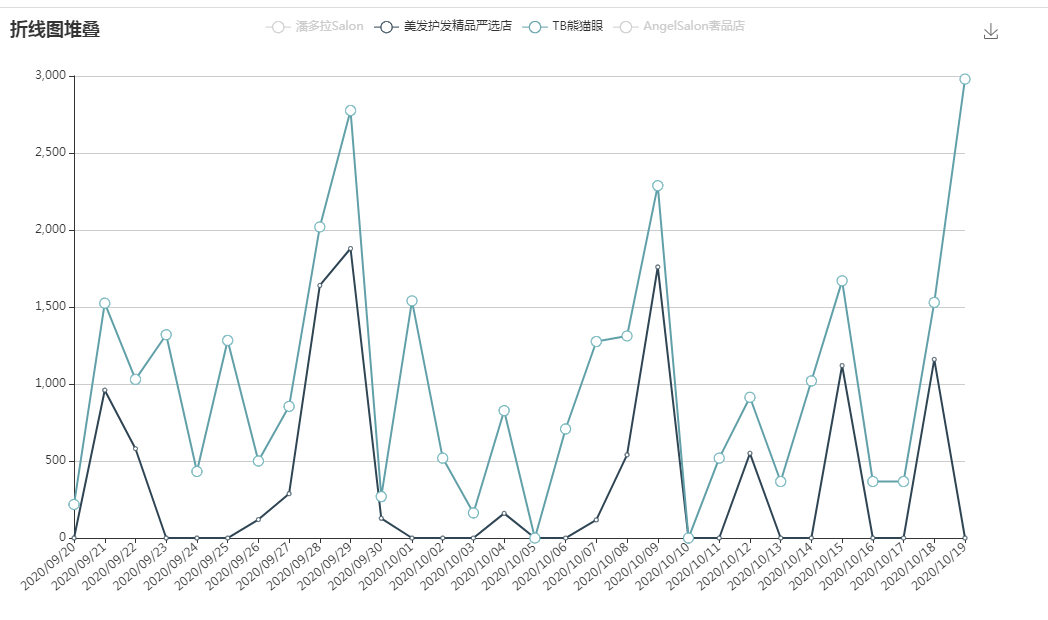
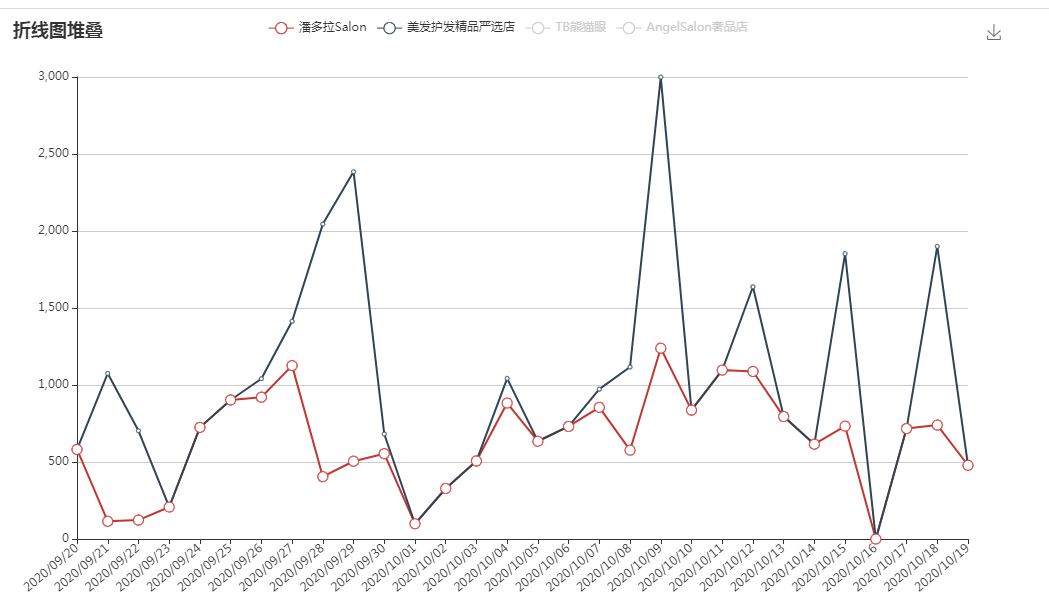
五、显示效果

六、对比值的改变
七、总结
这款产品还好,基本不动他了,
平时就补一下坑产和评价就可以了,
还有就是处理一下差评,
活动跟上其它卖家就可以了