1、被管理主机服务器上安装mysql_export组件
下载地址:https://prometheus.io/download/
安装mysql_exporter
~]# tar xf mysqld_exporter-0.12.1.linux-amd64.tar.gz -C /usr/local/
~]# cd /usr/local/
local]#  ln -s mysqld_exporter-0.12.1.linux-amd64/ ./mysqld_exporter

创建一个数据库账号并授权,用于peometheus获取监控数据
mysql> create user 'mysql_exporter'@'localhost' identified by '123123';
Query OK, 0 rows affected (0.01 sec)

mysql> grant select,replication client,process on *.* to 'mysql_exporter'@'localhost';
Query OK, 0 rows affected (0.00 sec)
创建.my.cnf配置文件
~]# vim /usr/local/mysqld_exporter/.my.cnf
[client]
user=mysql_exporter
password=123123

启动mysql_exporter
mysqld_exporter]# ./mysqld_exporter --config.my-cnf=/usr/local/mysqld_exporter/.my.cnf &

mysqld_exporter]# ss -anpt |grep :9104
LISTEN     0      128       [::]:9104                  [::]:*                   users:(("mysqld_exporter",pid=2784,fd=3))
2、Prometheus服务器配置文件中添加被监控得MySQL配置段
增加配置段
prometheus]# vim prometheus.yml
  - job_name: 'mysql-client'
    static_configs:
    - targets: ['192.168.53.8:9104']

重启服务
prometheus]# pkill prometheus
prometheus]# ps -ef |grep prometheus |grep -v grep
prometheus]# ./prometheus --config.file=/usr/local/prometheus/prometheus.yml &
prometheus]# netstat -anpt |grep :9090
tcp        0      0 192.168.53.6:58602      192.168.53.6:9090       ESTABLISHED 1982/./prometheus
tcp6       0      0 :::9090                 :::*                    LISTEN      1982/./prometheus
tcp6       0      0 192.168.53.6:9090       192.168.53.6:58602      ESTABLISHED 1982/./prometheus
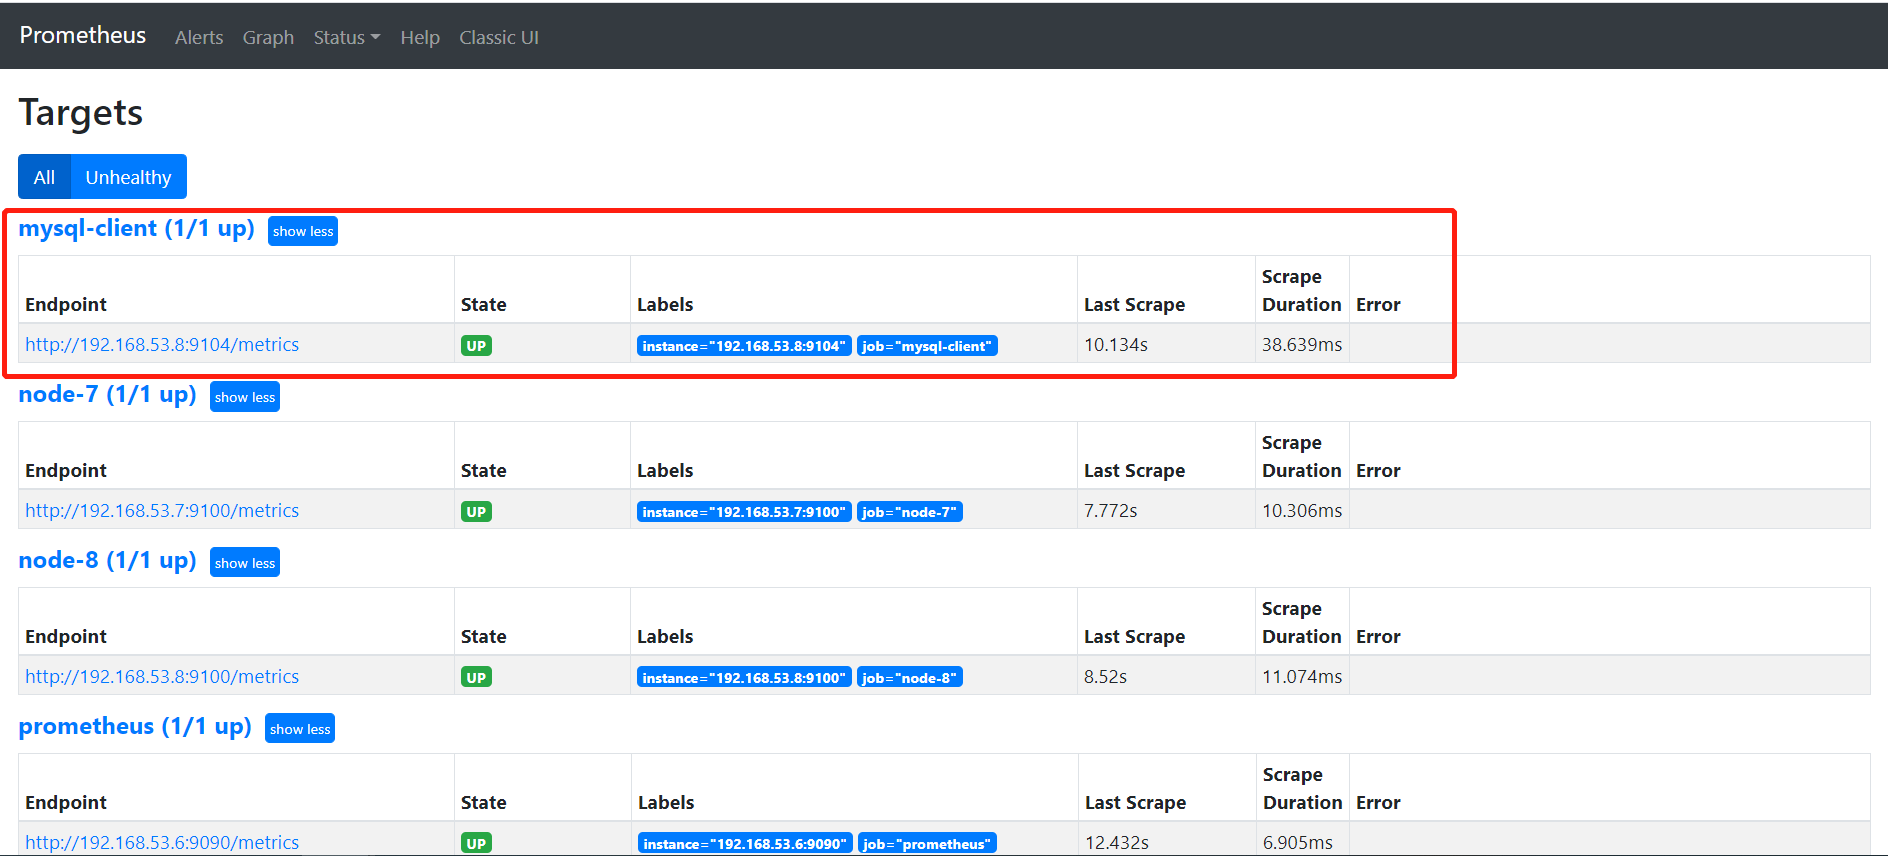
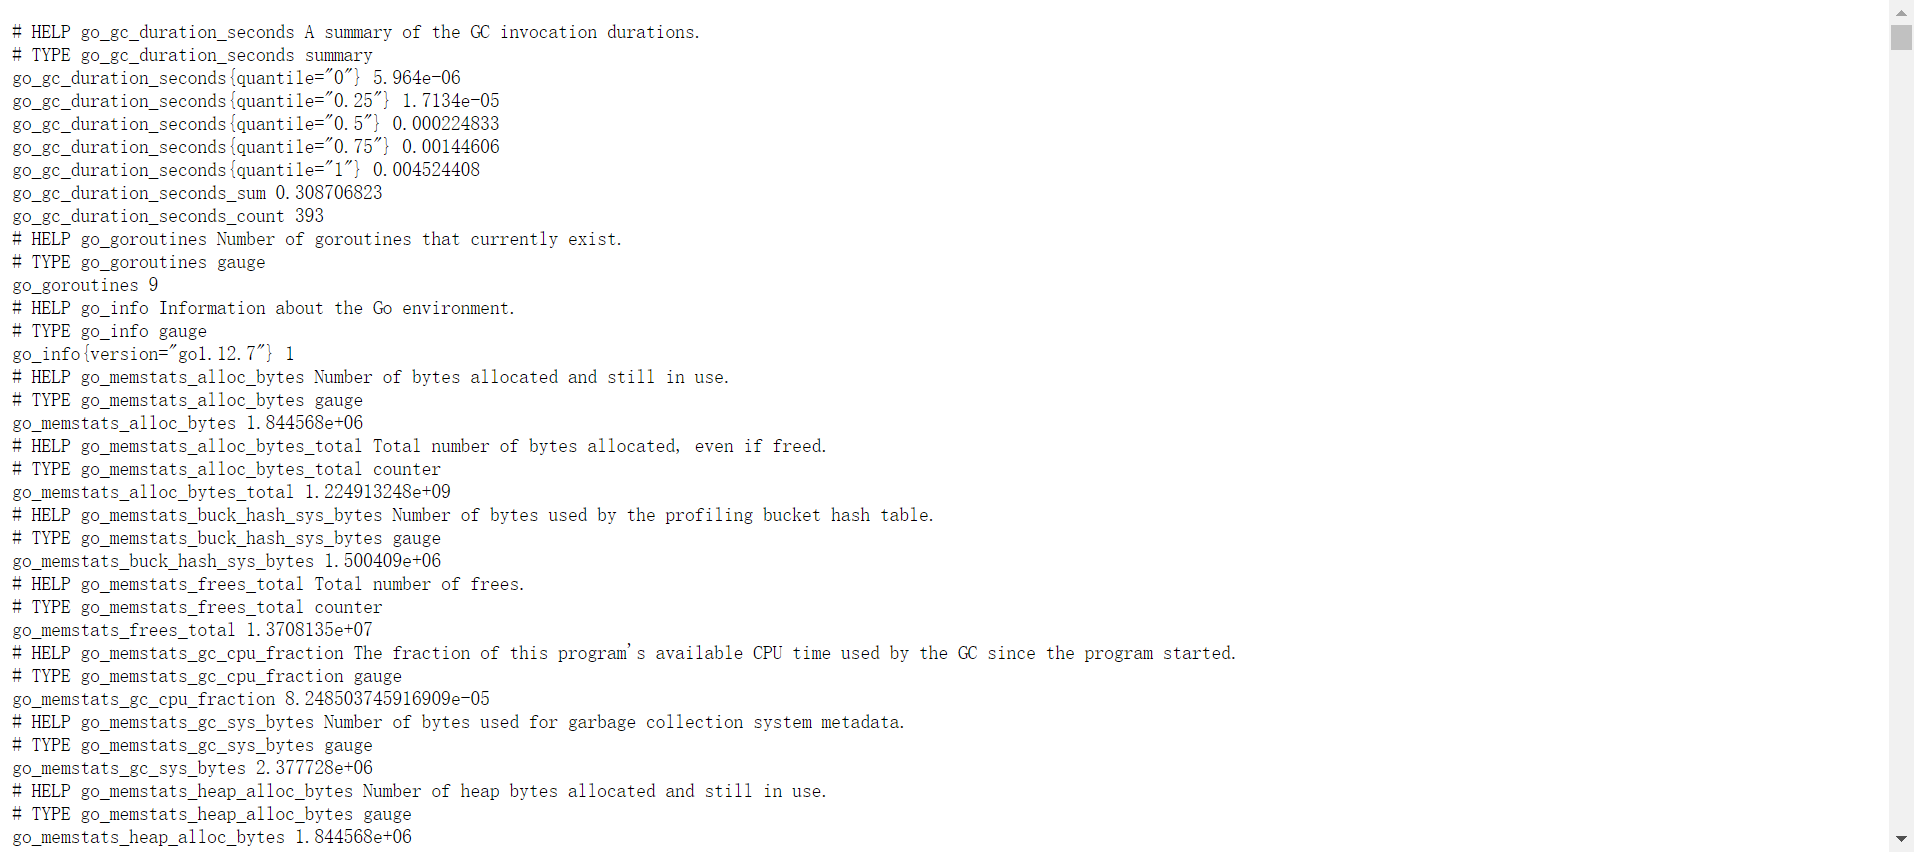
外部访问数据路径为:http://192.168.53.8:9104/metrics