使用sublime xdebug可以进行远程调试,可以使用chrome安装Debug插件,其实也可以直接使用任何浏览器进行访问和远程调试,本人一开始使用了chrome安装Debug插件的方式,后来才发现不用安装也可以直接进行调试。具体步骤如下:
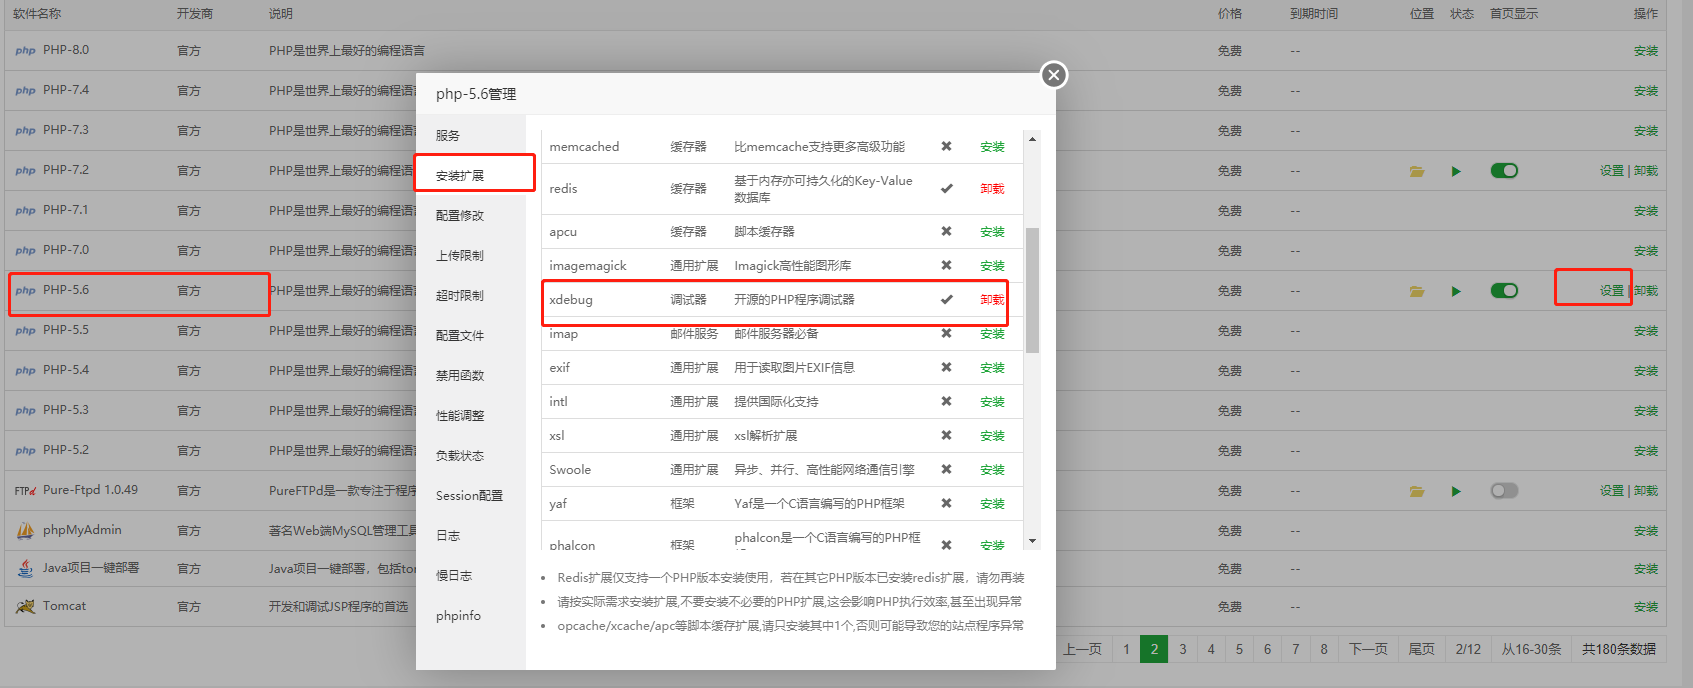
第一步:安装php xdebug扩展
(本人使用宝塔安装,一键搞定)
参考http://www.xdebug.org/docs/install
讲的很详细,这里略过。
第二步:安装sublime xdebugclient(不是xdebug)
直接用package control安装即可
第三步:配置php xdebug扩展
windows:
-
[XDebug]
-
zend_extension = "D:xamppphpextphp_xdebug.dll" #(位置一定要正确)
-
xdebug.remote_autostart=1
-
xdebug.remote_enable = On
-
xdebug.remote_host = "xxx.xxx.xxx.xxx" #这里是远程调试,即为你sublime开发机器的ip地址(可以使用路由器将公司的IP请求转发到自己的机器上)
-
xdebug.remote_port = 9001 #默认为9000,防止与php-fpm冲突,改为9001(你sublime开发机器防火墙一定要打开这个端口,不然断点无效)
-
xdebug.remote_handler = "dbgp"
linux:
文件位置:......./php/56/etc/php.ini或者....../php/72/etc/php.ini具体要看PHP的版本
[XDebug]
xdebug.remote_enable = 1
xdebug.remote_autostart = 1
xdebug.remote_host = xxx.xxx.xxx.xxx #这里是远程调试,即为你sublime开发机器的ip地址(可以使用路由器将公司的IP请求转发到自己的机器上)
xdebug.idekey="sublime.xdebug"
xdebug.remote_handler = "dbgp"
xdebug.remote_req = req
xdebug.remote_port = 9001 #默认为9000,防止与php-fpm冲突,改为9001(你sublime开发机器防火墙一定要打开这个端口,不然断点无效)
xdebug.remote_connect_back = 1
xdebug.auto_trace = 1
xdebug.collect_includes = 1
xdebug.collect_params = 1
xdebug.collect_vars = on
xdebug.show_local_vars = 1
xdebug.remote_log = /tmp/xdebug.log
zend_extension=/www/server/php/56/lib/php/extensions/no-debug-non-zts-20131226/xdebug.so #(位置一定要正确)
如下图:

第四步:配置sublime xdebug
用sublime打开你要调试的程序,点击sublime导航的Project->save project as。生成一个.sublime-project的文件,修改其为:
本地调试配置
-
{
-
"folders":
-
[
-
{
-
"path": "/D/xampp/htdocs" #这里应该会自动生成
-
}
-
],
-
"settings":
-
{
-
"xdebug": {
-
"path_mapping": {
-
}, #本机调试此项不需要设置
-
"url": "http://localhost/xampp/php.php",#这里为xdebug打开的页面
-
"super_globals": true,
-
"close_on_stop": true,
-
"port": 9001 #此port与之前xdebug扩展一致
-
}
-
}
-
}
远程调试配置
-
{
-
"folders":
-
[
-
{
-
"path": "/D/biwebs"
-
}
-
],
-
"settings":
-
{
-
"xdebug": {
-
"path_mapping": {
-
"/data/web/dataoa/" : "D:/biwebs/dataoa/" #与本地就此处不同,必须将远程与本地的映射写明
-
},
-
"url": "http://testdata.zhenai.com/test.php",
-
"super_globals": true,
-
"close_on_stop": true,
-
"port": 9001
-
}
-
}
-
}
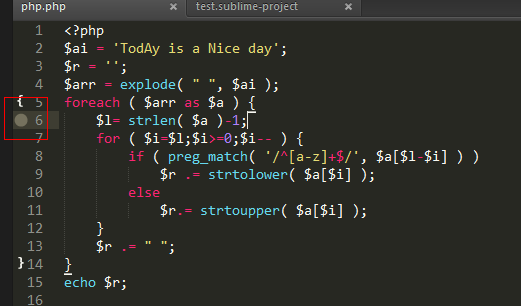
下面来看下效果:
(本地)
1.先在试例代码中标记个断点(ctrl+F8)
2、开启xdebug,打开浏览器,或者其他工具访问站点开始进行调试(不只是chrome哦,任何浏览器都可以)
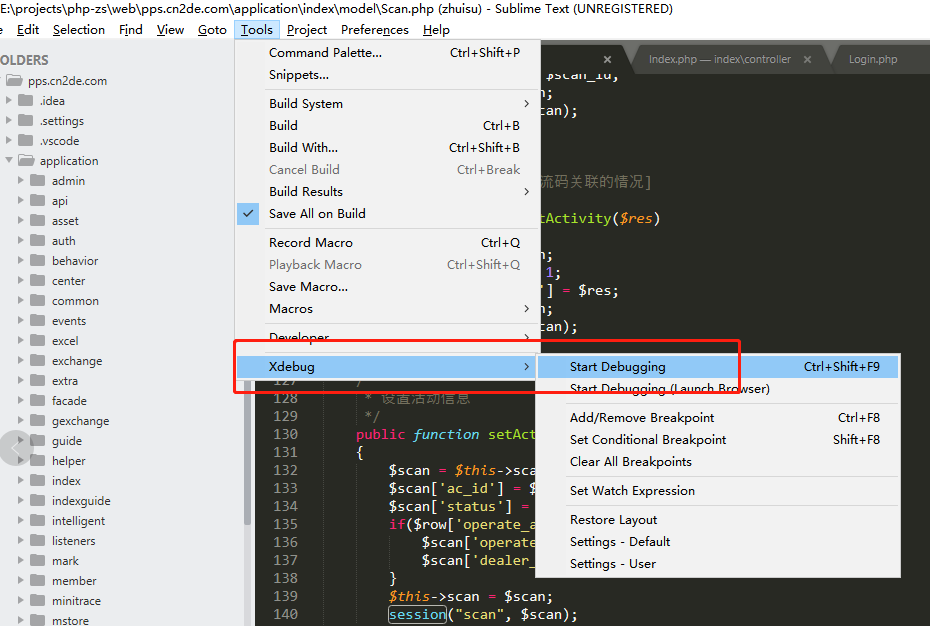
3、调试代码
一些常用快捷键
Shift+f8: 打开调试面板
f8:打开调试面板快速连接
Ctrl+f8: 切换断点
Ctrl+Shift+f5: 运行到下一个断点
Ctrl+Shift+f6: 单步
Ctrl+Shift+f7: 步入
Ctrl+Shift+f8: 步出

变量一目了然展示在眼前。
具体其它操作见https://github.com/martomo/SublimeTextXdebug
远程也是如此,前提是两台机器必须是互通的。调不通多点耐心,相信胜利就在眼前!
如果遇到不能跳转到断点的问题,可能是本地(你IDE所在的机器)的端口没有开放(本人使用的是9001),也可能是服务器端口被占用(需要重新启动并加载PHP再试)
