1. 说明
这个 demo 主要显示3D的柱状图,而且是具有地理位置信息的柱状图,比echart那些二维的柱状图效果当然要好很多。
2. 初始化地图
1 var map = new maptalks.Map("map", { 2 center: [19.06325670775459, 42.16842479475318], 3 zoom: 3, 4 pitch: 60, 5 // bearing: 180, 6 7 centerCross: true, 8 doubleClickZoom: false, 9 baseLayer: new maptalks.TileLayer('tile', { 10 urlTemplate: 'https://{s}.basemaps.cartocdn.com/dark_all/{z}/{x}/{y}.png', 11 subdomains: ['a', 'b', 'c', 'd'], 12 attribution: '© <a href="http://osm.org">OpenStreetMap</a> contributors, © <a href="https://carto.com/">CARTO</a>' 13 }) 14 });
3. 添加 threelayer 图层,并设置webgl 三要素。
 1         // the ThreeLayer to draw buildings
 2         var threeLayer = new maptalks.ThreeLayer('t', {
 3             forceRenderOnMoving: true,
 4             forceRenderOnRotating: true
 5             // animation: true
 6         });
 7         threeLayer.prepareToDraw = function (gl, scene, camera) {
 8             var light = new THREE.DirectionalLight(0xffffff);
 9             light.position.set(0, -10, 10).normalize();
10             scene.add(light);
11             scene.add(new THREE.AmbientLight(0xffffff, 0.5));
12             setTimeout(() => {
13                 addBars(scene);
14             }, 1000);
15
16         };
17         threeLayer.addTo(map);
4. 添加柱状图,数据使用的是 ../data/population.json , 从格式可以看出,每个数据包含三项内容,经度、纬度、数值。
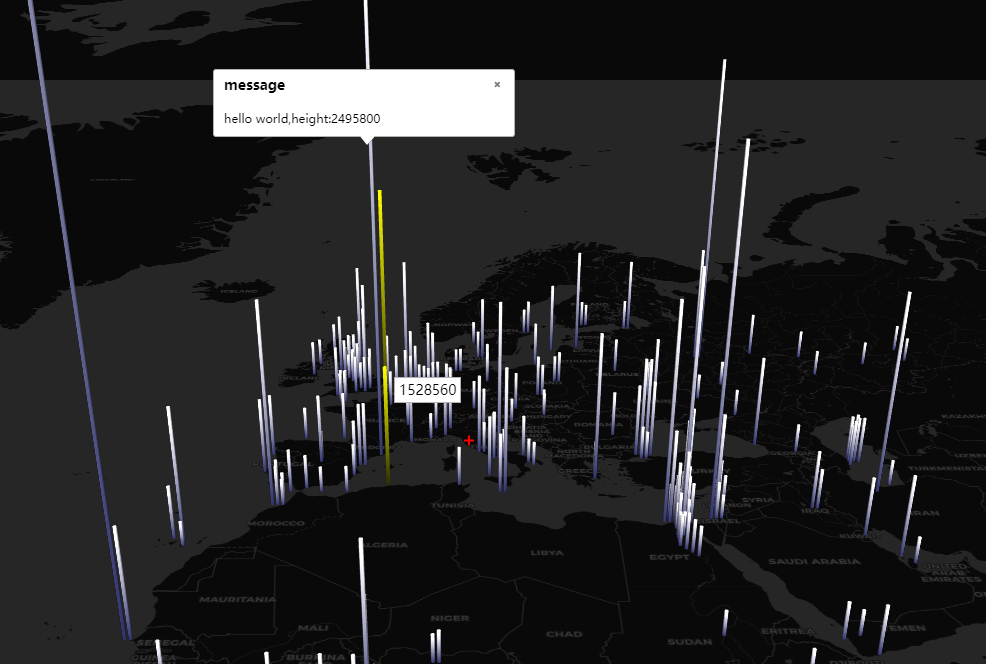
代码里添加了两个变量,material 和 highlightmaterial , 当鼠标移动到物体上时,则变换颜色。

 1    var bars;
 2         var material = new THREE.MeshLambertMaterial({ color: '#fff', transparent: true });
 3         var highlightmaterial = new THREE.MeshBasicMaterial({ color: 'yellow', transparent: true });
 4         function addBars(scene) {
 5             fetch('./data/population.json').then((function (res) {
 6                 return res.json();
 7             })).then(function (json) {
 8                 const time = 'time';
 9                 console.time(time);
10                 bars = json.filter(function (dataItem) {
11                     return dataItem[2] > 500;
12                 }).slice(0, Infinity).map(function (dataItem) {
13                     return {
14                         coordinate: dataItem.slice(0, 2),
15                         height: dataItem[2]
16                     }
17                 }).map(function (d) {
18                     var bar = threeLayer.toBar(d.coordinate, {
19                         height: d.height * 400,
20                         radius: 15000,
21                         topColor: '#fff',
22                         // radialSegments: 4
23                     }, material);
24
25                     // tooltip test
26                     bar.setToolTip(d.height * 400, {
27                         showTimeout: 0,
28                         eventsPropagation: true,
29                         dx: 10
30                     });
31
32
33                     //infowindow test
34                     bar.setInfoWindow({
35                         content: 'hello world,height:' + d.height * 400,
36                         title: 'message',
37                         animationDuration: 0,
38                         autoOpenOn: false
39                     });
40
41
42                     //event test
43                     ['click', 'mouseout', 'mouseover', 'mousedown', 'mouseup', 'dblclick', 'contextmenu'].forEach(function (eventType) {
44                         bar.on(eventType, function (e) {
45                             // console.log(e.type, e);
46                             // console.log(this);
47                             if (e.type === 'mouseout') {
48                                 this.setSymbol(material);
49                             }
50                             if (e.type === 'mouseover') {
51                                 this.setSymbol(highlightmaterial);
52                             }
53                         });
54                     });
55
56                     return bar;
57                 });
58
59                 console.log(bars);
60                 console.timeEnd(time);
61                 // bars.forEach(function (bar) {
62                 //     scene.add(bar.getObject3d());
63                 // });
64                 // threeLayer.renderScene();
65                 threeLayer.addMesh(bars);
66                 initGui();
67                 threeLayer.config('animation', true);
68             })
69         }
5. 事件, 代码中定义了事件的处理方式,可以同时处理多个事件类型,通过 type 再进行分别处理。
 1    ['click', 'mouseout', 'mouseover', 'mousedown', 'mouseup', 'dblclick', 'contextmenu'].forEach(function (eventType) {
 2                         bar.on(eventType, function (e) {
 3                             // console.log(e.type, e);
 4                             // console.log(this);
 5                             if (e.type === 'mouseout') {
 6                                 this.setSymbol(material);
 7                             }
 8                             if (e.type === 'mouseover') {
 9                                 this.setSymbol(highlightmaterial);
10                             }
11                         });
12                     });
6. 另外被注释的代码里包括 tooltip 和 InfoWindow。
tooltip 是鼠标移动到物体上时,提示的文字内容,Info 是点击物体时弹出的提示内容。
两者还是有区别的。

 1                     // tooltip test
 2                      bar.setToolTip(d.height * 400, {
 3                          showTimeout: 0,
 4                          eventsPropagation: true,
 5                          dx: 10
 6                      });
 7
 8
 9                     //infowindow test
10                      bar.setInfoWindow({
11                          content: 'hello world,height:' + d.height * 400,
12                          title: 'message',
13                          animationDuration: 0,
14                          autoOpenOn: false
15                      });
7. 显示效果
8. 源码地址
https://github.com/WhatGIS/maptalkMap/tree/main/threelayer/demo