目录
一、 Grafana自定义图形
1.安装grafana
[root@m01 /data/soft]# wget https://dl.grafana.com/oss/release/grafana-6.3.2-1.x86_64.rpm
[root@m01 /data/soft]# yum localinstall grafana-6.3.2-1.x86_64.rpm -y
[root@m01 /data/soft]# systemctl start grafana-server.service
[root@m01 /data/soft]# systemctl enable grafana-server.service
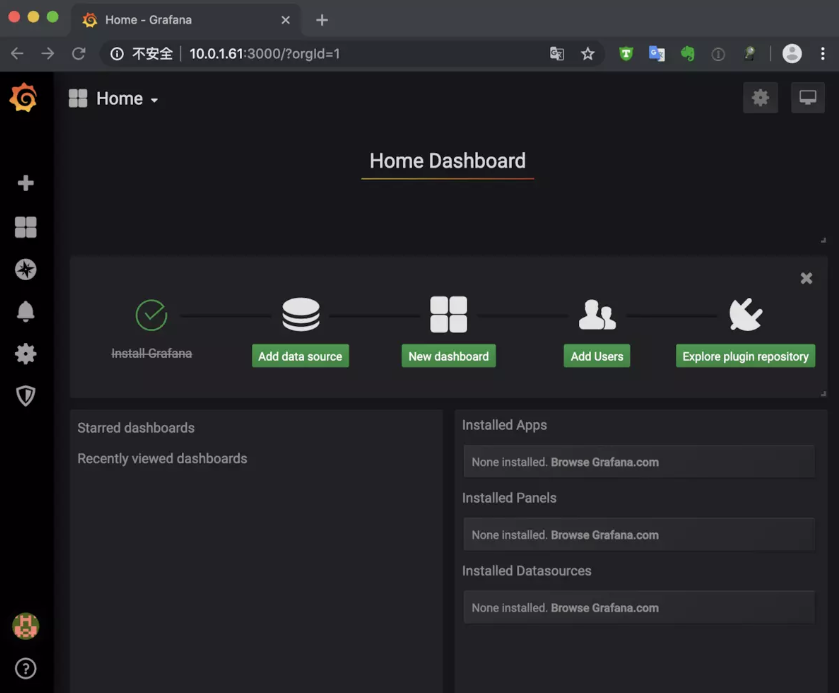
访问grafana:http://10.0.0.61:3000
账号密码:admin admin
2.安装并激活zabbix插件
[root@m01 ~]# grafana-cli plugins list-remote|grep zabbix
id: alexanderzobnin-zabbix-app version: 3.10.4
[root@m01 ~]# grafana-cli plugins install alexanderzobnin-zabbix-app
[root@m01 ~]# systemctl restart grafana-server.service


#或者直接上传插件到目录 /var/lib/grafana/plugins
#解压之后生成目录
[root@m01 plugins]# ll
total 2588
drwxr-xr-x 8 root root    4096 Aug  8 17:56 alexanderzobnin-grafana-zabbix-29a98f5
-rw-r--r-- 1 root root 2643241 Dec 17 09:20 alexanderzobnin-grafana-zabbix-v3.10.4-1-g29a98f5.zip
[root@m01 alexanderzobnin-grafana-zabbix-29a98f5]# ll
total 384
-rw-r--r-- 1 root root  14310 Aug  8 17:56 CHANGELOG.md
drwxr-xr-x 8 root root    185 Aug  8 17:56 dist
drwxr-xr-x 3 root root     56 Aug  8 17:56 docs
-rw-r--r-- 1 root root    423 Aug  8 17:56 Gruntfile.js
-rw-r--r-- 1 root root    697 Aug  8 17:56 jest.config.js
-rw-r--r-- 1 root root  11379 Aug  8 17:56 LICENSE
-rw-r--r-- 1 root root   2806 Aug  8 17:56 package.json
-rw-r--r-- 1 root root   4053 Aug  8 17:56 README.md
drwxr-xr-x 9 root root    166 Aug  8 17:56 src
-rw-r--r-- 1 root root    592 Aug  8 17:56 tsconfig.json
-rw-r--r-- 1 root root     91 Aug  8 17:56 tsconfig.test.json
-rw-r--r-- 1 root root   2397 Aug  8 17:56 tslint.json
drwxr-xr-x 2 root root    118 Aug  8 17:56 webpack
-rw-r--r-- 1 root root 332834 Aug  8 17:56 yarn.lock
[root@m01 alexanderzobnin-grafana-zabbix-29a98f5]# pwd
/var/lib/grafana/plugins/alexanderzobnin-grafana-zabbix-29a98f5
[root@m01 ~]# systemctl restart grafana-server.service
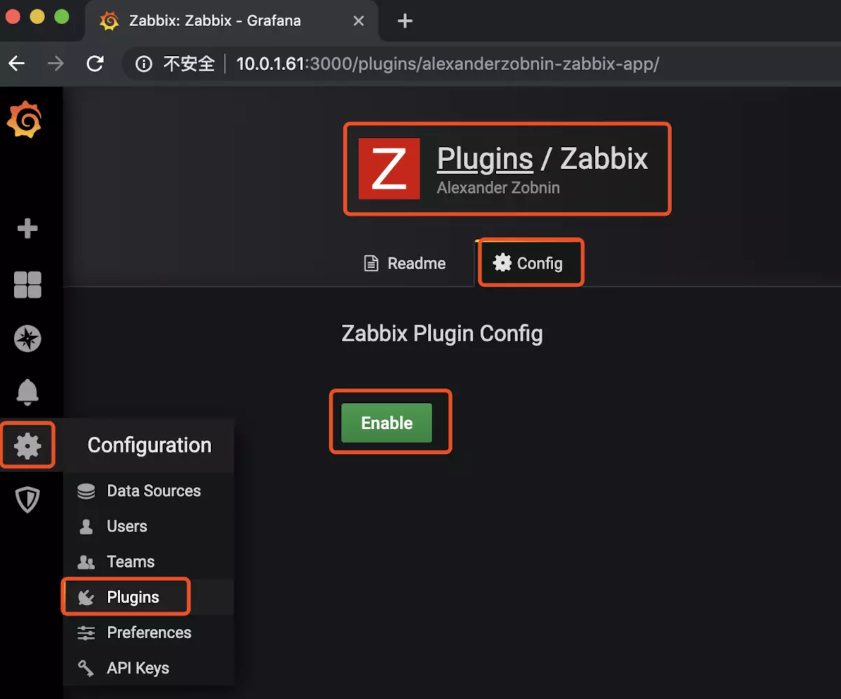
网页操作-激活zabbix插件
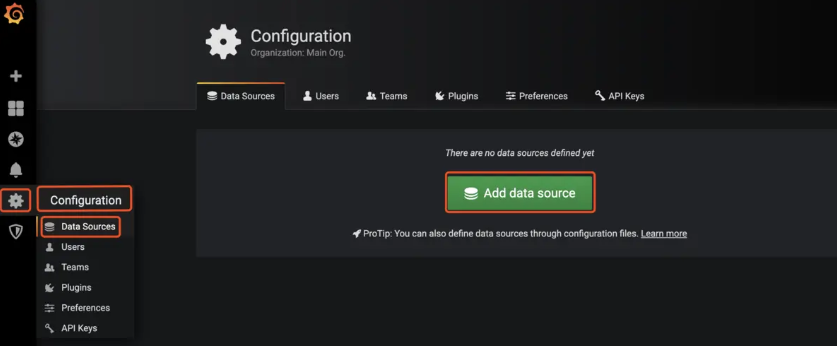
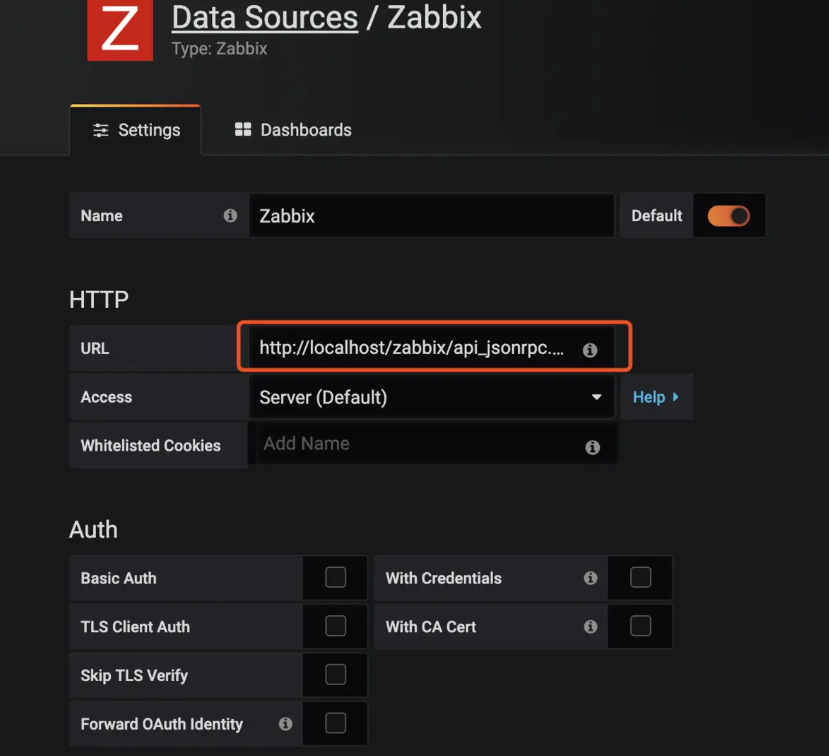
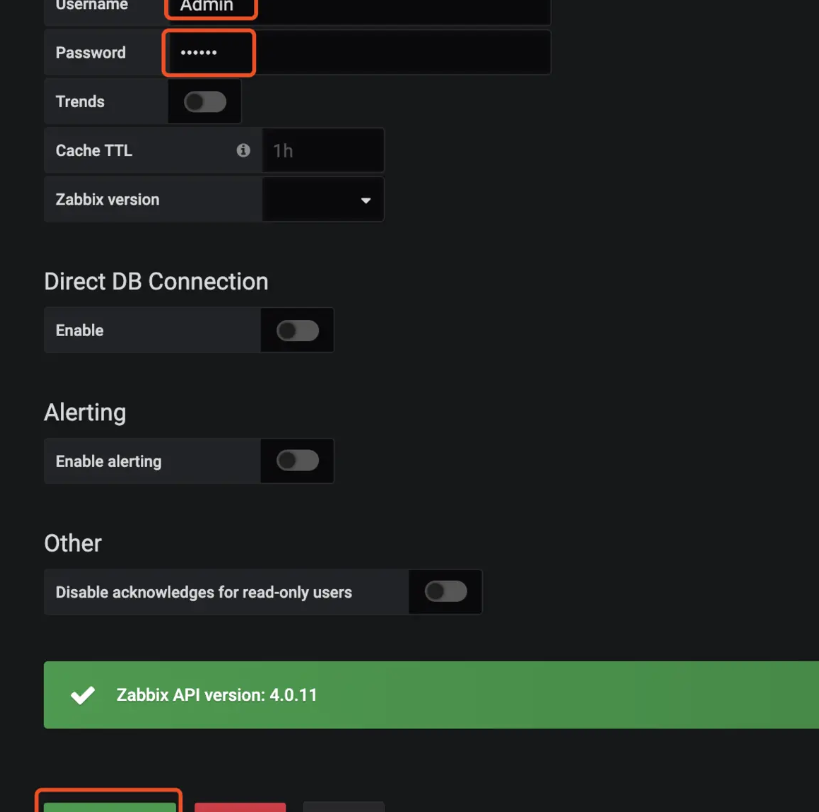
网页操作-添加zabbix数据源
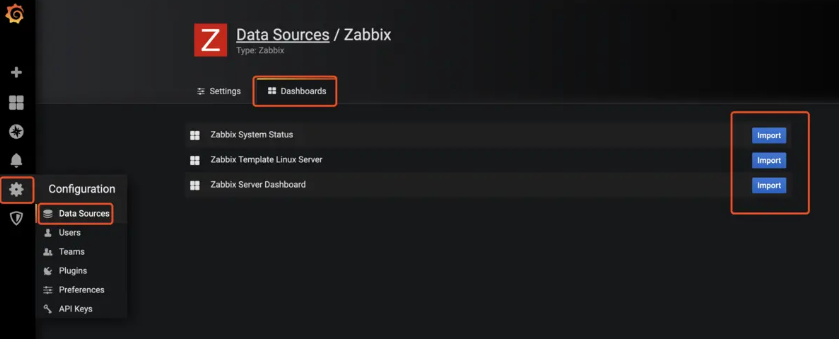
网页操作-导入模版
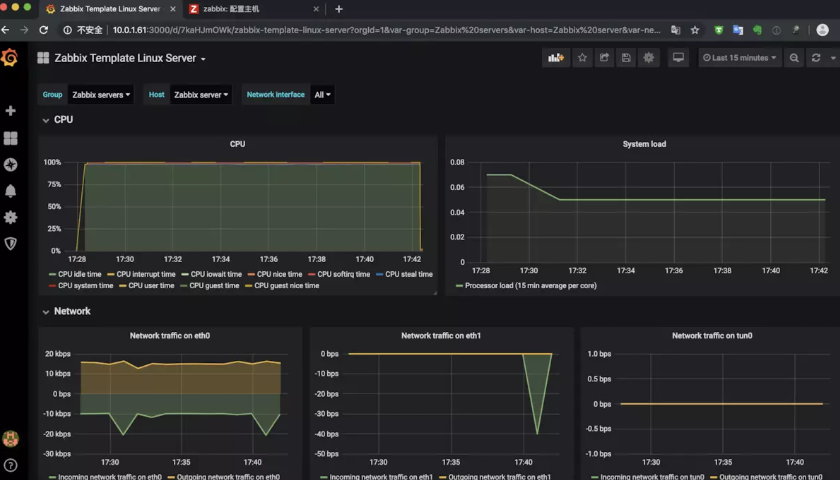
3.数据展示
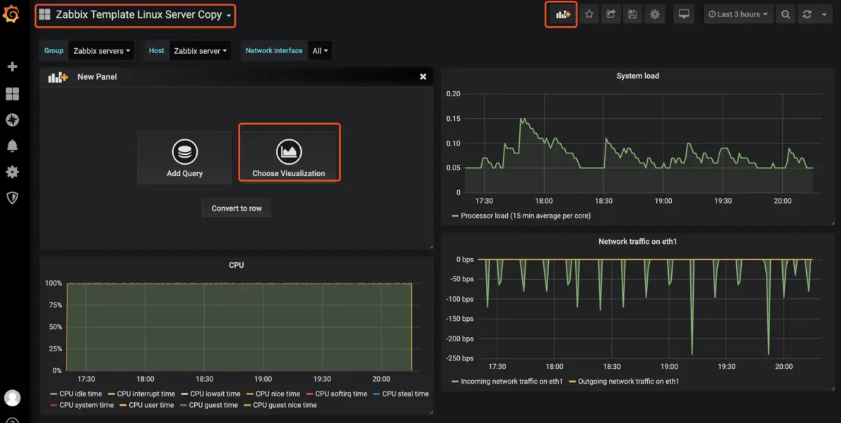
4.自定义图形仪表盘
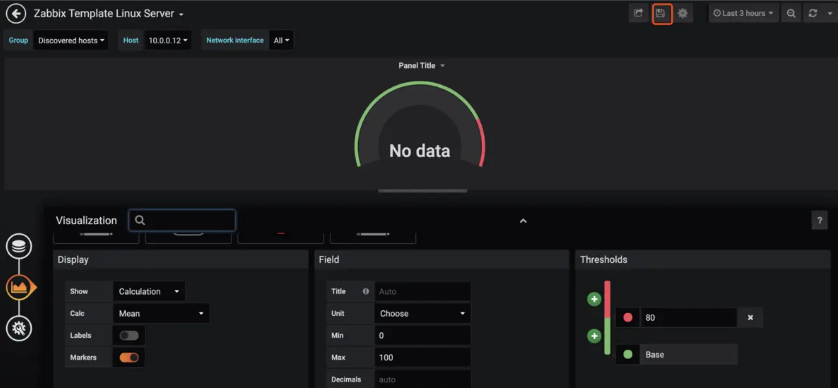
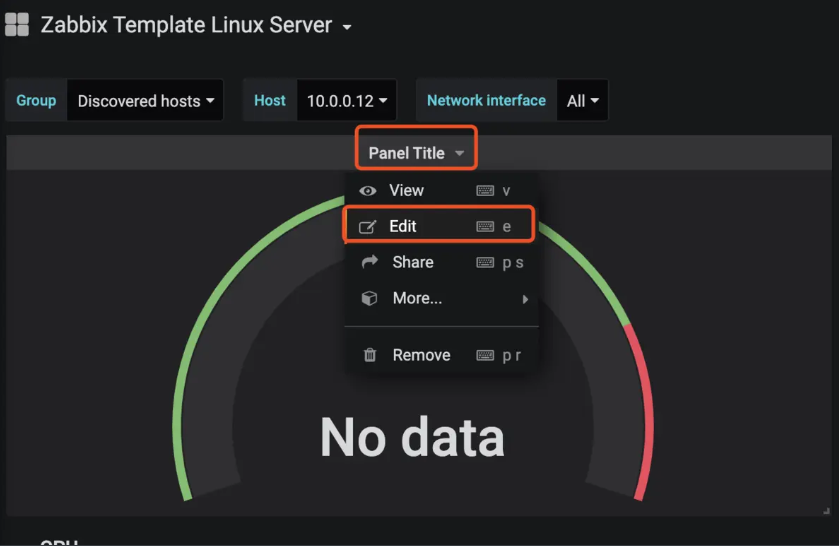

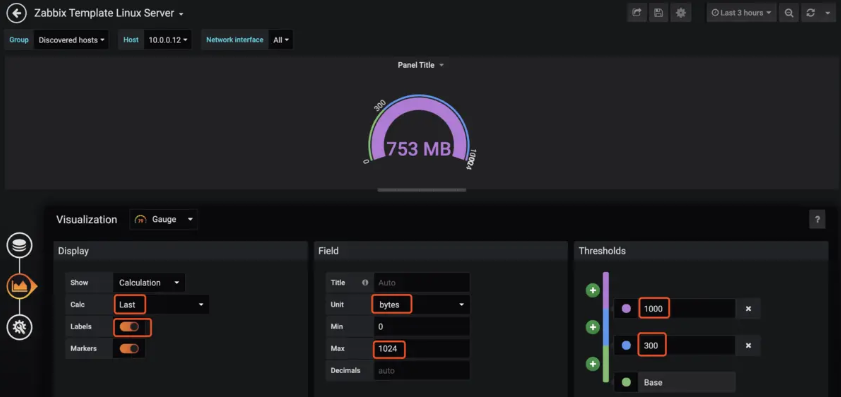
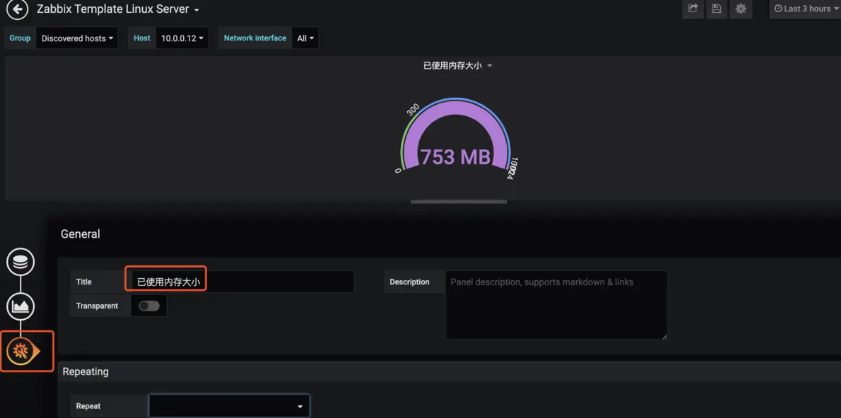
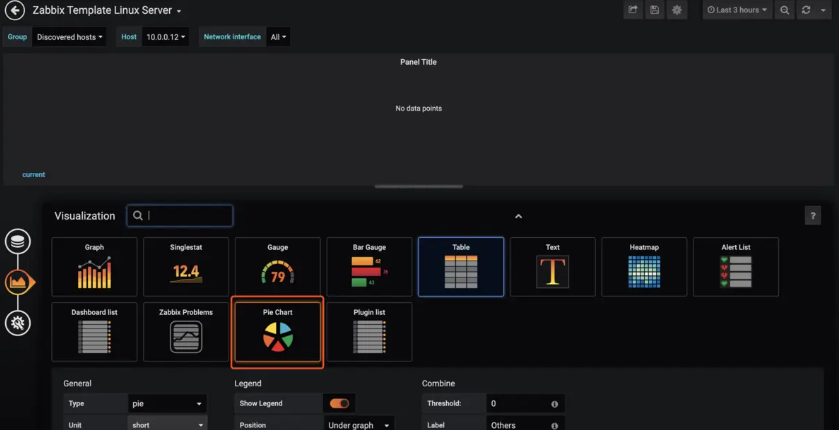
5.自定义图形饼图
1.安装插件
在线安装方式
grafana-cli plugins install grafana-piechart-panel
离线安装方式
wget -nv https://grafana.com/api/plugins/grafana-piechart-panel/versions/latest/download -O /tmp/grafana-piechart-panel.zip
unzip -q /tmp/grafana-piechart-panel.zip -d /tmp
mv /tmp/grafana-piechart-panel-* /var/lib/grafana/plugins/grafana-piechart-panel
service grafana-server restart
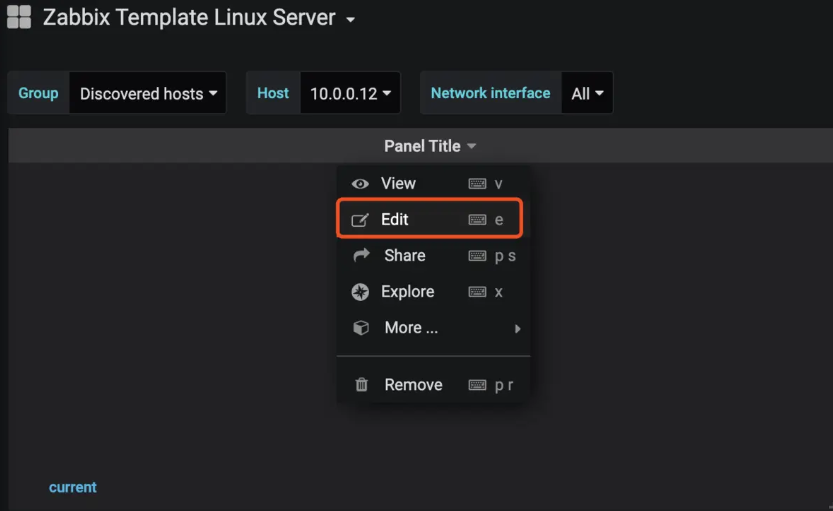
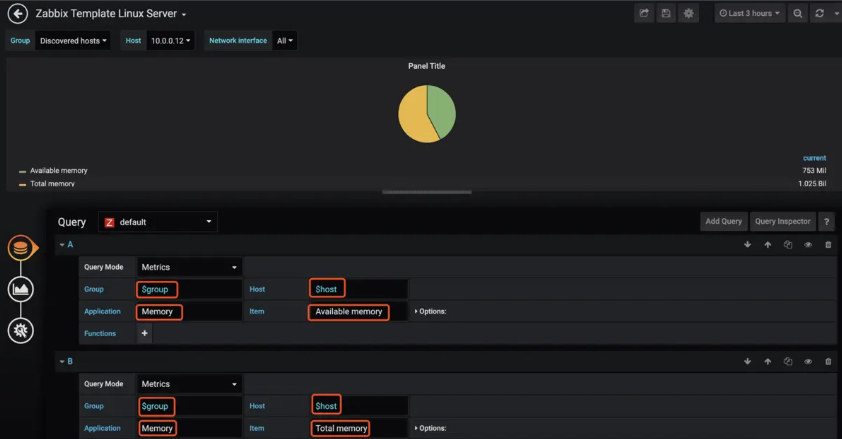
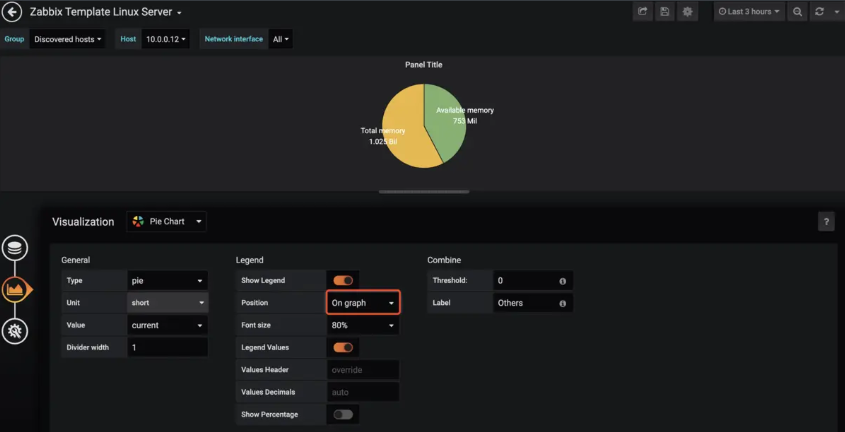
2.配置图形
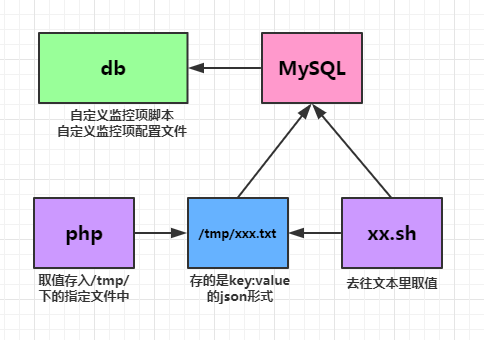
二、 percona模版监控mysql
参考强哥的博客
https://www.qstack.com.cn/archives/213.html
1.安装php环境
percona需要php环境
[root@m01 /data/soft]# yum install php php-mysql -y
2.下载软件

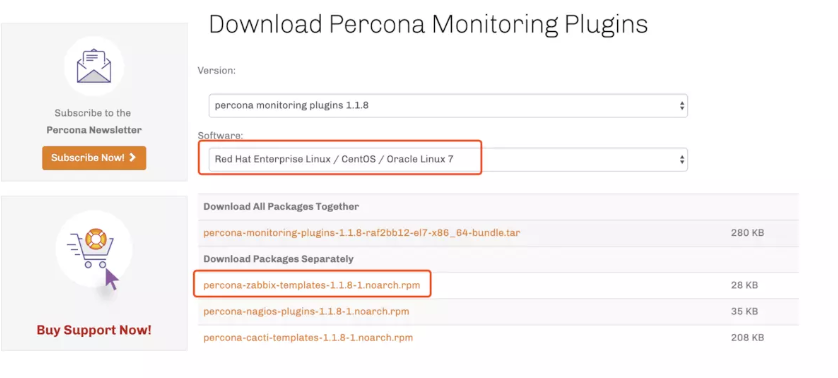
注意,安装完成后会有提示模版的路径位置
[root@m01 ~]# cd /data/soft/
[root@m01 /data/soft]# wget https://www.percona.com/downloads/percona-monitoring-plugins/percona-monitoring-plugins-1.1.8/binary/redhat/7/x86_64/percona-zabbix-templates-1.1.8-1.noarch.rpm
[root@m01 /data/soft]# rpm -ivh percona-zabbix-templates-1.1.8-1.noarch.rpm
警告:percona-zabbix-templates-1.1.8-1.noarch.rpm: 头V4 DSA/SHA1 Signature, 密钥 ID cd2efd2a: NOKEY
准备中...                          ################################# [100%]
正在升级/安装...
   1:percona-zabbix-templates-1.1.8-1 ################################# [100%]

Scripts are installed to /var/lib/zabbix/percona/scripts
Templates are installed to /var/lib/zabbix/percona/templates
3.查看目录
进入安装目录会发现有2个目录,一个是脚本目录,一个是模版目录
[root@m01 ~]# cd /var/lib/zabbix/percona/
[root@m01 /var/lib/zabbix/percona]# tree
.
├── scripts
│   ├── get_mysql_stats_wrapper.sh
│   └── ss_get_mysql_stats.php
└── templates
    ├── userparameter_percona_mysql.conf
    └── zabbix_agent_template_percona_mysql_server_ht_2.0.9-sver1.1.8.xml
其中脚本目录里有2个脚本,用来获取数据库信息
[root@m01 /var/lib/zabbix/percona]# cd scripts/
[root@m01 /var/lib/zabbix/percona/scripts]# ls
get_mysql_stats_wrapper.sh  ss_get_mysql_stats.php
4.修改get_mysql_stats_wrapper.sh
修改get_mysql_stats_wrapper数据库登陆信息
第19行添加mysql账号密码
[root@m01 v]# sed -n '19p' get_mysql_stats_wrapper.sh
    RES=`HOME=~zabbix mysql -uroot -p123456 -e 'SHOW SLAVE STATUSG' | egrep '(Slave_IO_Running|Slave_SQL_Running):' | awk -F: '{print $2}' | tr '
'
5.修改ss_get_mysql_stats.php
[root@m01 /var/lib/zabbix/percona/scripts]# sed -n '30,31p' ss_get_mysql_stats.php
$mysql_user = 'root';
$mysql_pass = '123456';
6.复制自定义监控项配置文件到zabbix目录
[root@m01 ~]# cd /var/lib/zabbix/percona/templates/
[root@m01 /var/lib/zabbix/percona/templates]# cp userparameter_percona_mysql.conf /etc/zabbix/zabbix_agentd.d/
[root@m01 /var/lib/zabbix/percona/templates]# cd /etc/zabbix/zabbix_agentd.d/
[root@m01 /etc/zabbix/zabbix_agentd.d]# ls
userparameter_mysql.conf  userparameter_percona_mysql.conf
7.重启agent
[root@m01 ~]# systemctl restart zabbix-agent
8.测试key
[root@m01 ~]# zabbix_get -s 10.0.1.61 -k MySQL.Sort-scan
16
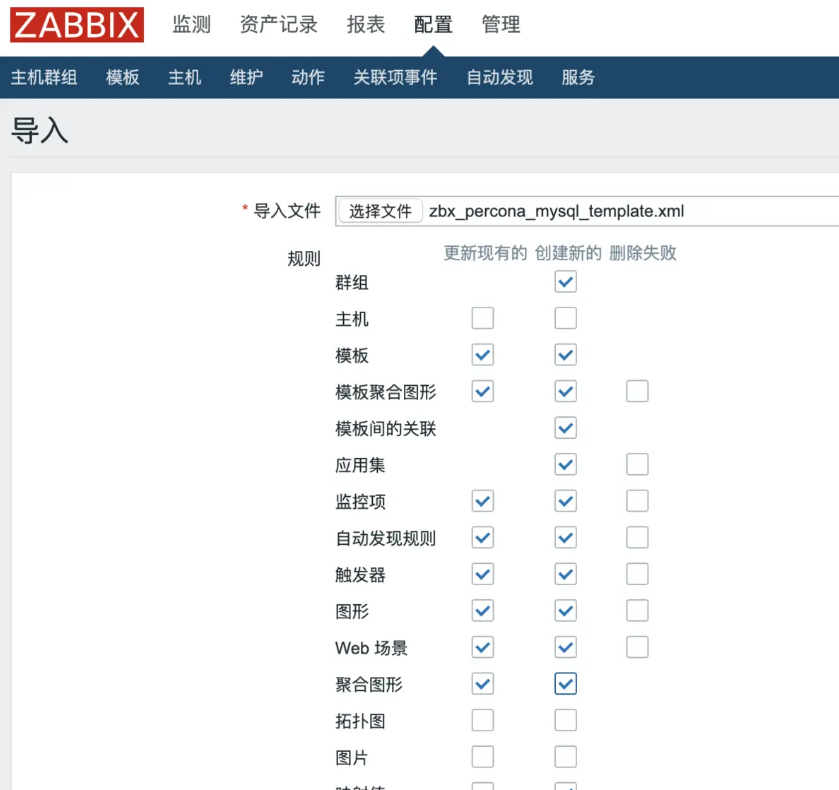
9.导入模版
官方自带的模版有点问题,需要先装在2.x版本然后导出来,这里使用网友已经修改好的模版上传
http://pan.baidu.com/s/1pL1wDYj
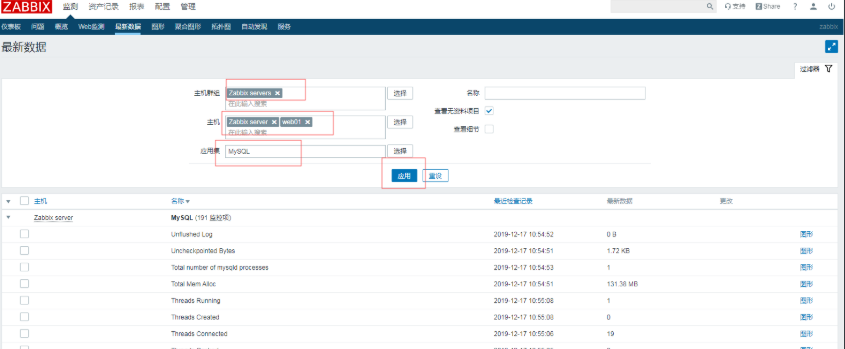
10.主机链接模版
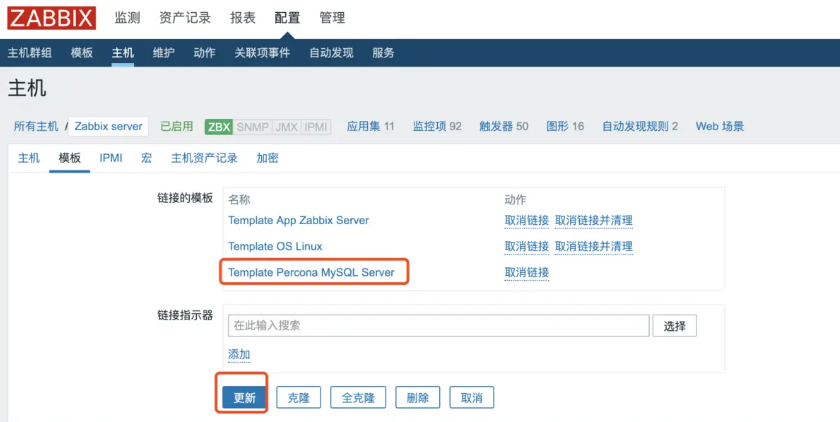
监测----更新数据----修改主机---应用集-----应用。
11.报错解决
查看监控发现没有数据显示不支持类型
查看zabbix-server发现因为tmp的文件没有权限,因为刚才手动执行了脚本,所以文件属性是root,将文件删除后由zabbix自己创建解决问题
报错日志如下:
2846:20190811:202708.785 item "Zabbix server:MySQL.State-init" became not supported: Value "rm: 无法删除"/tmp/localhost-mysql_cacti_stats.txt": 不允许的操作
0" of type "string" is not suitable for value type "Numeric (float)"
  2843:20190811:202709.787 item "Zabbix server:MySQL.State-locked" became not supported: Value "rm: 无法删除"/tmp/localhost-mysql_cacti_stats.txt": 不允许的操作
0" of type "string" is not suitable for value type "Numeric (float)"
  2844:20190811:202710.788 item "Zabbix server:MySQL.State-login" became not supported: Value "rm: 无法删除"/tmp/localhost-mysql_cacti_stats.txt": 不允许的操作
0" of type "string" is not suitable for value type "Numeric (float)"
三、 自动发现和自动注册
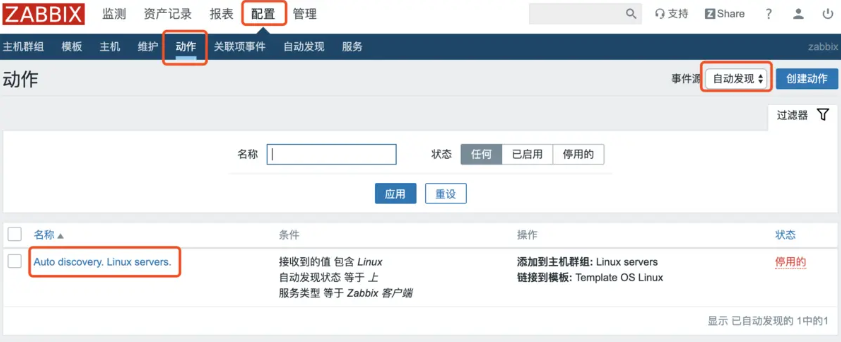
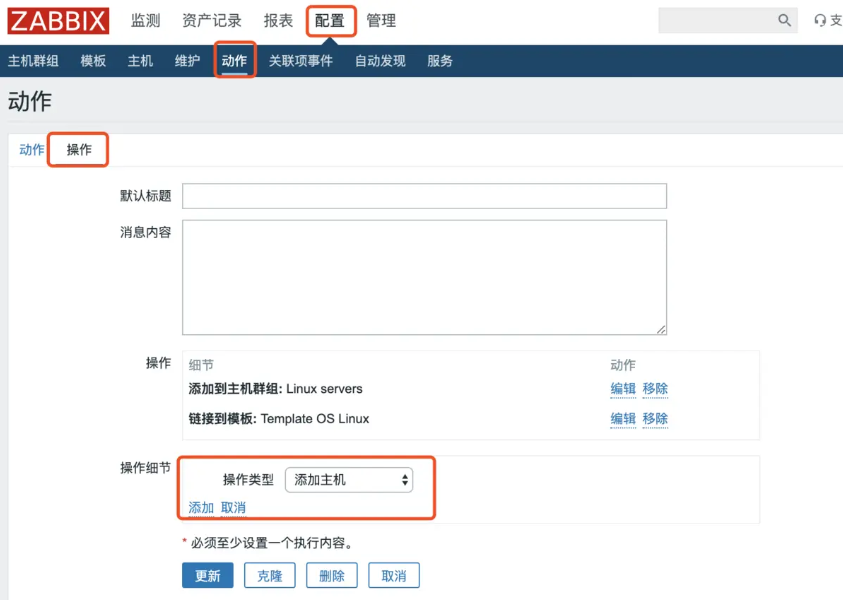
1.自动发现
web页面操作
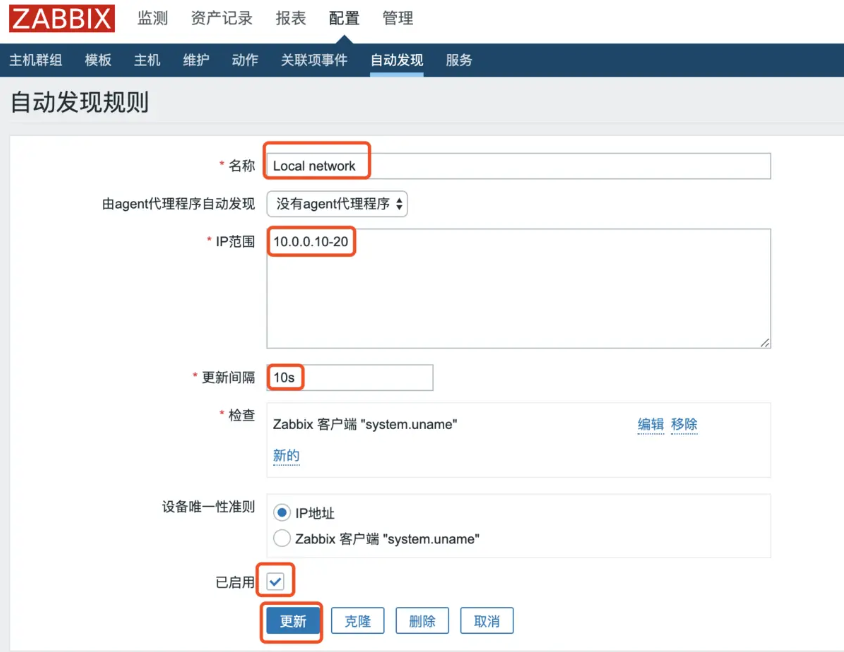
image.png
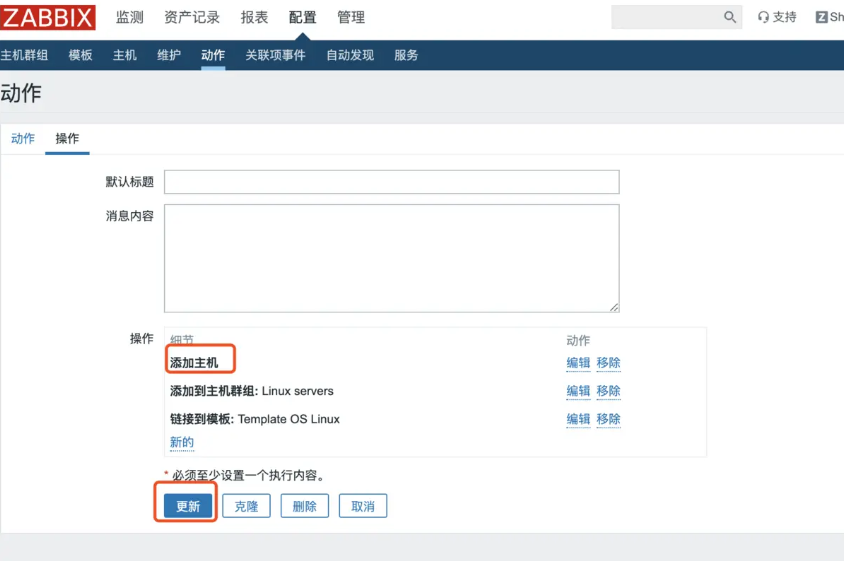
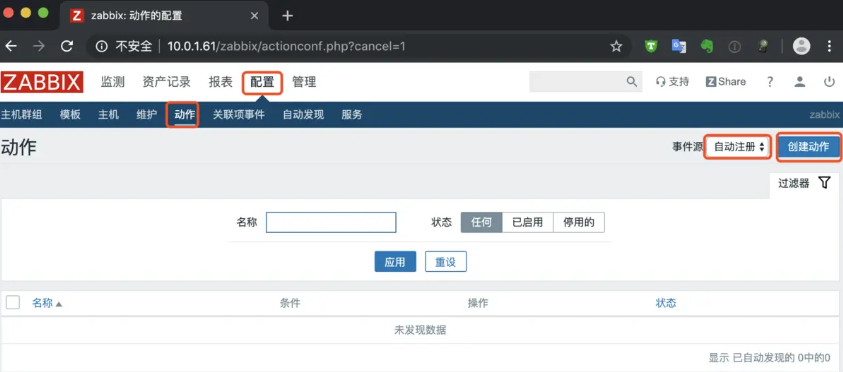
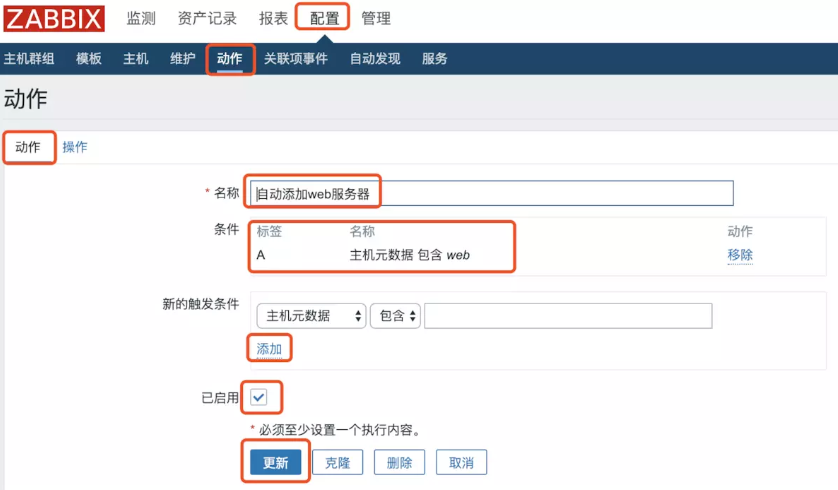
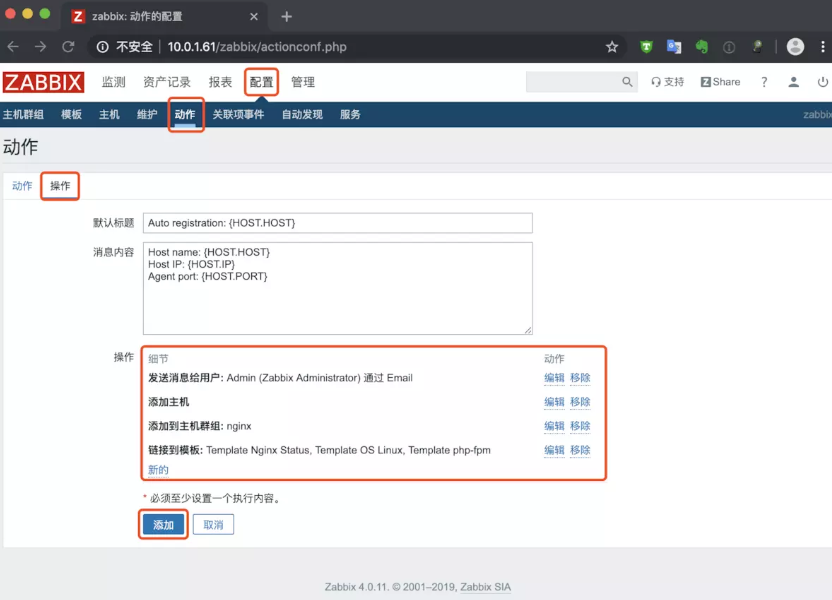
2.自动注册
修改zabbix-agent配置文件
[root@web02 ~]# cat /etc/zabbix/zabbix_agentd.conf
PidFile=/var/run/zabbix/zabbix_agentd.pid
LogFile=/var/log/zabbix/zabbix_agentd.log
LogFileSize=0
Server=10.0.1.61
ServerActive=10.0.1.61
Hostname=web02
Include=/etc/zabbix/zabbix_agentd.d/*.conf
web页面操作
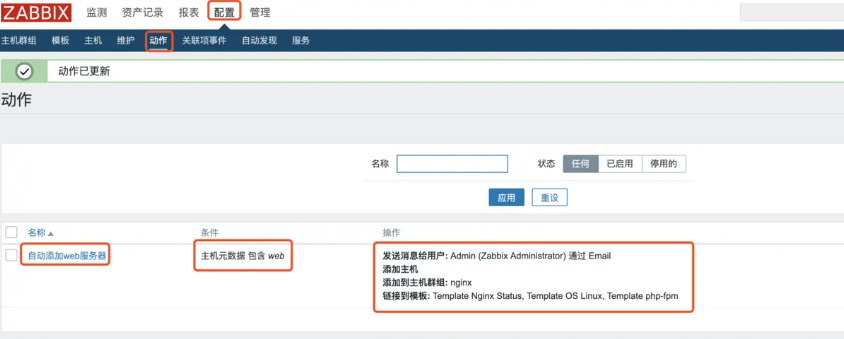
刷新查看发现已经添加上了
