前言
leaflet 入门开发系列环境知识点了解:
- leaflet api文档介绍,详细介绍 leaflet 每个类的函数以及属性等等
- leaflet 在线例子
- leaflet 插件,leaflet 的插件库,非常有用
内容概览
leaflet 结合 Echarts4 实现统计图
源代码 demo 下载
本文 leaflet 结合 Echarts4 实现三种形式统计图:
- Leaflet Popup
- Leaflet Control
- Leaflet Marker
实现效果图如下: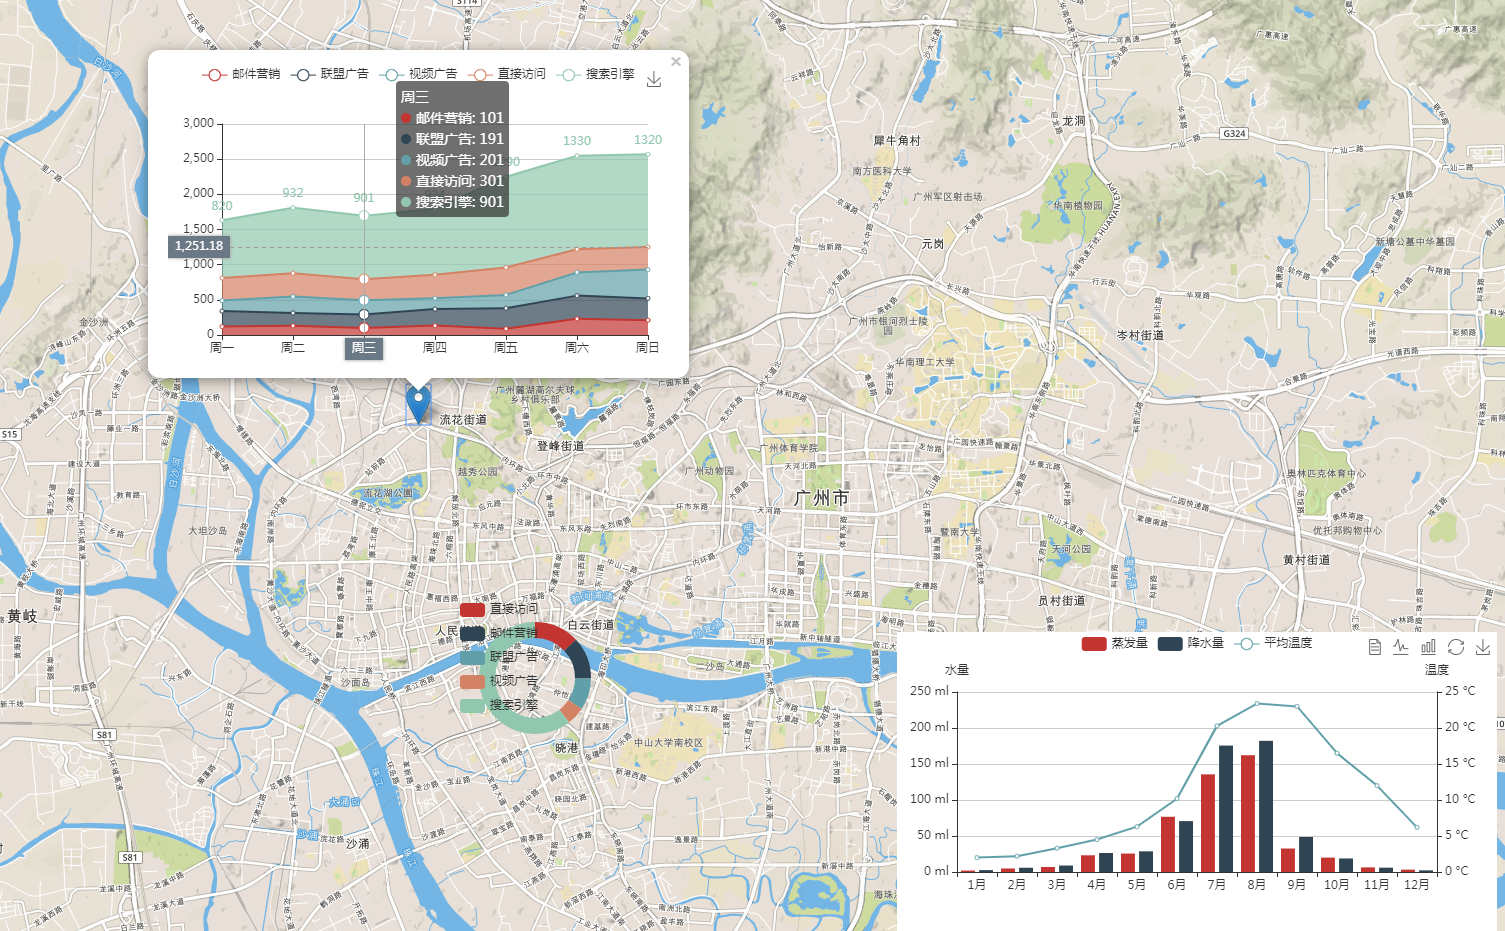
- Leaflet Popup
通过弹出窗口实现 Leaflet,在 popup 的 popupopen 事件触发时重载 echarts
function initControl_Popup(map){
var popChartMarker=L.marker([23.15,113.25]).addTo(map);
//配置弹出框
var content='<div style="500px;height:300px" id="mark"></div>';
popChartMarker.bindPopup(content,{maxWidth:2000});
popChartMarker.on('popupopen',function(e){
var myChart=echarts.init(document.getElementById('mark'));
var option = {
title: {
text: ''
},
tooltip : {
trigger: 'axis',
axisPointer: {
type: 'cross',
label: {
backgroundColor: '#6a7985'
}
}
},
legend: {
data:['邮件营销','联盟广告','视频广告','直接访问','搜索引擎']
},
toolbox: {
feature: {
saveAsImage: {}
}
},
grid: {
left: '3%',
right: '4%',
bottom: '3%',
containLabel: true
},
xAxis : [
{
type : 'category',
boundaryGap : false,
data : ['周一','周二','周三','周四','周五','周六','周日']
}
],
yAxis : [
{
type : 'value'
}
],
series : [
{
name:'邮件营销',
type:'line',
stack: '总量',
areaStyle: {},
data:[120, 132, 101, 134, 90, 230, 210]
},
{
name:'联盟广告',
type:'line',
stack: '总量',
areaStyle: {},
data:[220, 182, 191, 234, 290, 330, 310]
},
{
name:'视频广告',
type:'line',
stack: '总量',
areaStyle: {},
data:[150, 232, 201, 154, 190, 330, 410]
},
{
name:'直接访问',
type:'line',
stack: '总量',
areaStyle: {normal: {}},
data:[320, 332, 301, 334, 390, 330, 320]
},
{
name:'搜索引擎',
type:'line',
stack: '总量',
label: {
normal: {
show: true,
position: 'top'
}
},
areaStyle: {normal: {}},
data:[820, 932, 901, 934, 1290, 1330, 1320]
}
]
};
myChart.setOption(option);
});
}
- Leaflet Control
主要就是初始一个 control,并在并给其中的容器 DIV 附上 class 和 id,id 用于创建图表时能找到该容器,class 用于控制 control 的样式
完整demo源码见小专栏文章尾部:GIS之家leaflet小专栏
文章尾部提供源代码下载,对本专栏感兴趣的话,可以关注一波