。
安装echarts
npm install echarts -S
封装全局组件:
@/utils/myCharts.js
import * as echarts from 'echarts';
// 图表统一放在此处
const install = function (Vue) {
  Object.defineProperties(Vue.prototype, {
    $chart: {
      get() {
        return {
          // 热力图
          hotPicture: function (id, data) {
            console.log(data,"data")
            let realData = data.data.map(item => {
              return [item[0],item[1],item[2].sum || "-"]
            })
            console.log(realData,"realData");
            this.chart = echarts.init(document.getElementById(id));
            this.chart.clear();
            const optionData = {
              title: {
                  text: '热力图',
                  left: 'center',
                  textStyle: {
                      fontWeight: 'normal',
                  },
              },
              dataZoom: [
                {
                  show: true,
                  realtime: true,
                  start: 0,
                  marginTop: 10,
                  end: 100,
                  // bottom: -10
                },
              ],
              tooltip: {//提示
                position: 'bottom',
                formatter:(params) => {
                  var arr = data.data.filter(item => {
                    return item[0] == params.value[0];
                  });
                  var sourseItem = arr.find(item => {
                    return params.value[1] == item[1];
                  })
                  console.log(sourseItem,"sourseItem");
                  var htmlStr = '<div style="height: auto;max-height: 240px;overflow-y: auto;font-size:12px;">';
                  for (var i = 0; i < sourseItem[2].behavior.length; i++) {
                    var option  = sourseItem[2].behavior[i];
                    console.log(option,"option");
                    htmlStr += '<div style="color: #666;">' + '<span style="font-weight:600;">' + option.name + '</span>' + ':' + '<span>'  + option.num + '</span>' + '</div>';
                  }
                  htmlStr += '</div>'
                  return htmlStr;
                }
              },
              grid: {
                  height: '50%',
                  top: '10%'
              },
              xAxis: {
                  type: 'category',
                  data: data.times,
                  splitArea: {
                      show: true
                  }
              },
              yAxis: {
                  type: 'category',
                  data: data.names,
                  splitArea: {
                      show: true
                  }
              },
              visualMap: {
                min: 0,
                max: 10,//多少次达到颜色最重
                calculable: true,
                orient: 'horizontal',
                left: 'center',
                bottom: '15%',
                type: 'continuous',//默认  还有piecewise
                // pieces: [{//piecewise配置对应的颜色区间
                //   gt: 0,
                //   lte: 10,
                //   color: '#008143'
                // }, {
                //     gt: 10,
                //     lte: 20,
                //     color: '#8D0020'
                // },]
              },
              series: [{
                  name: '提示标题',
                  type: 'heatmap',//热力图类型
                  data: realData,//数据
                  label: {
                      show: true
                  },
                  emphasis: {
                      itemStyle: {
                          shadowBlur: 10,//阴影的模糊度
                          shadowColor: 'rgba(0, 0, 0, 0.5)',//鼠标晃过某一项时的阴影样式
                      }
                  }
              }]
            };
            this.chart.setOption(optionData);
            setTimeout(() =>{
              window.onresize = ()=>{
                this.chart.resize();
              }
            },200)
          },
        }//return
      }
    }
  })
}

export default {
  install
}
main.js引入
import myCharts from "@/utils/myCharts.js";
Vue.use(myCharts);//封装的echarts组件
调用:
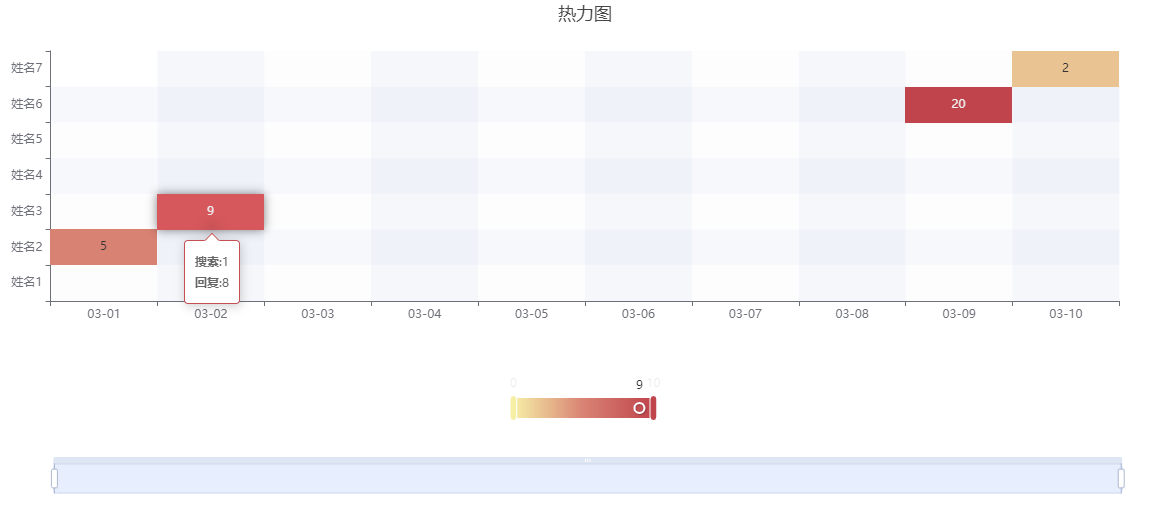
<template>
  <div>
    <div id="hotPicture" style=" 100%;height:500px;"></div>
  </div>
</template>

<script>
  export default {
    data(){
      return {
        data:{
          times:['03-01', '03-02', '03-03', '03-04', '03-05', '03-06', '03-07',
            '03-08', '03-09', '03-10',
          ],//X轴数据-日期
          names:['姓名1', '姓名2', '姓名3','姓名4', '姓名5', '姓名6', '姓名7'],//y轴数据-姓名
          data:[
            [0,1,{sum:5,behavior:[{name:"搜索",num:1},{name:"回复",num:4}]}],// 3/1,姓名2,5次
            [1,2,{sum:9,behavior:[{name:"搜索",num:1},{name:"回复",num:8}]}],// 3/2,姓名3,,9次
            [9,6,{sum:2,behavior:[{name:"搜索",num:1},{name:"回复",num:1}]}],// 3/10,姓名7,2次
            [8,5,{sum:20,behavior:[{name:"搜索",num:10},{name:"回复",num:10}]}],// 3/9,姓名6,20次
          ],
        }
      }
    },
    mounted(){
      this.$chart.hotPicture("hotPicture",this.data)
    }
  }
</script>
效果:
新配置:
//热力图
          hotPicture: function (id, data) {
            console.log(data,"data")
            let realData = data.data.map(item => {
              return [item[0],item[1],item[2].sum || "-"]
            });
            this.chart = echarts.init(document.getElementById(id));
            this.chart.clear();
            const optionData = {
              // title: {
              //     text: '热力图',
              //     left: 'center',
              //     textStyle: {
              //         fontWeight: 'normal',
              //     },
              // },
              dataZoom: [
                {
                  show: true,
                  realtime: true,
                  start: 0,
                  marginTop: 10,
                  end: 100,
                  height:0,//缩放区域高度
                  moveHandleSize:20,//滑块宽度
                  handleSize:40,//缩放手柄宽度
                },
                {
                  type: 'slider',
                  yAxisIndex: 0,
                  filterMode: 'none',
                  zoomLock:false,//显示值不能扩大,是固定值(20)
                  startValue: 0, // 从头开始。
                  endValue:19, // 一次性展示20个
                  right:40,
                  top:60,
                  0,//缩放区域宽度
                  moveHandleSize:20,//滑块宽度
                  handleSize:40,//缩放手柄宽度
                },
              ],
              tooltip: {//提示
                position: 'bottom',
                backgroundColor: 'rgba(0,0,0,.5)',
                formatter:(params) => {
                  var arr = data.data.filter(item => {
                    return item[0] == params.value[0];
                  });
                  var sourseItem = arr.find(item => {
                    return params.value[1] == item[1];
                  })
                  // console.log(sourseItem,"sourseItem");
                  var htmlStr = '<div style="height: auto;max-height: 240px;overflow-y: auto;font-size:12px;">';
                  htmlStr += '<div style="color: #fff;">' + '<span style="font-weight:600;">' + vue.$t('operationFrequency') + '</span>' + ':' + '<span>'  + sourseItem[2].sum + '</span>' + '</div>';
                  for (var i = 0; i < sourseItem[2].behavior.length; i++) {
                    var option  = sourseItem[2].behavior[i];
                    htmlStr += '<div style="color: #fff;">' + '<span style="font-weight:600;">' + vue.$t(option.name) + '</span>' + ':' + '<span>'  + option.num + '</span>' + '</div>';
                  }
                  htmlStr += '</div>'
                  return htmlStr;
                }
              },
              grid: {
                  height: '470',
                  top: '60',
                  bottom:'70',
                  right:'60'
              },
              xAxis: {
                  type: 'category',
                  data: data.times,
                  splitArea: {
                      show: true
                  }
              },
              yAxis: {
                  type: 'category',
                  data: data.names.map(item => {return item.replace(/?d+$/,"")}),
                  splitArea: {
                      show: true
                  }
              },
              visualMap: {
                min: 0,
                max: 10,//多少次达到颜色最重
                calculable: true,
                orient: 'horizontal',
                right: '60',
                top: 'top',
                type: 'continuous',//默认  还有piecewise
                // pieces: [{//piecewise配置对应的颜色区间
                //   gt: 0,
                //   lte: 10,
                //   color: '#008143'
                // }, {
                //     gt: 10,
                //     lte: 20,
                //     color: '#8D0020'
                // },]
                inRange: {
                  color: ['#EBF1FF', '#C2D4FF', '#99B4FF','#7092FF','#486EFF','#324ED9'],
                  // symbolSize: [30, 100]
                },
              },
              series: [{
                  name: '提示标题',
                  type: 'heatmap',//热力图类型
                  data: realData,//数据
                  label: {
                      show: true,
                  },
                  emphasis: {
                      itemStyle: {
                          shadowBlur: 10,//阴影的模糊度
                          shadowColor: 'rgba(0, 0, 0, 0.5)',//鼠标晃过某一项时的阴影样式
                      }
                  }
              }]
            };
            this.chart.setOption(optionData);
            // this.chart.resize({height:(data.names.length * 20) + 316});
            this.chart.resize();
            setTimeout(() =>{
              window.onresize = ()=>{
                // this.chart.resize({height:(data.names.length * 20) + 316});
                this.chart.resize();
              }
            },200)
          },
。