一、R中数据结构
1、数据集
通常是由数据构成的一个矩形数组,行 表示 观测(记录、示例),列 表示 变量(字段、属性)

2、R中的数据结构

3、向量
c()可以用来创建向量
> a <- c(1,2,5,3,6,-2,4)
> b <- c("one","two","three")
> c <- c(TRUE,TRUE,TRUE,FALSE,TRUE,FALSE)

访问向量中的元素
> a[c(2,4)]
> a[2:6]
4、矩阵
矩阵是一个二维数组
> y <- matrix(1:20,nrow=5,ncol=4)
> y
     [,1] [,2] [,3] [,4]
[1,]    1    6   11   16
[2,]    2    7   12   17
[3,]    3    8   13   18
[4,]    4    9   14   19
[5,]    5   10   15   20
> y[,1]
> y[2,]
> mymatrix <- matrix(cells,nrow=2,ncol=2,byrow=TRUE,dimnames=list(rnames,cnames))
> mymatrix
   C1 C2
R1  1 26
R2 24 68


> mymatrix <- matrix(cells,nrow=2,ncol=2,byrow=FALSE,dimnames=list(rnames,cnames))
> mymatrix
   C1 C2
R1  1 24
R2 26 68
二、因子
类别(名义型)变量 和 有序类别(有序型)变量 在R中称为因子
> patientID <- c(1,2,3,4)
> age <- c(25,34,28,52)
> status <- c("Poor","Improved","Excellent","Poor")
> status <- factor(status,order=TRUE)
> patientdata <- data.frame(patientID,age,diabetes,status)
> patientdata <- data.frame(patientID,age,diabetes,status)
> str(patientdata)
'data.frame':   4 obs. of  4 variables:
 $ patientID: num  1 2 3 4
 $ age      : num  25 34 28 52
 $ diabetes : Factor w/ 2 levels "Type1","Type2": 1 2 1 1
 $ status   : Ord.factor w/ 3 levels "Excellent"<"Improved"<..: 3 2 1 3
> summary(patientdata)
   patientID         age         diabetes       status
 Min.   :1.00   Min.   :25.00   Type1:3   Excellent:1
 1st Qu.:1.75   1st Qu.:27.25   Type2:1   Improved :1
 Median :2.50   Median :31.00             Poor     :2
 Mean   :2.50   Mean   :34.75
 3rd Qu.:3.25   3rd Qu.:38.50
 Max.   :4.00   Max.   :52.00
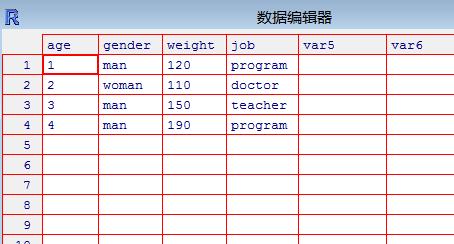
三、数据输入
> mydata <- data.frame(age=numeric(0),gender=character(0),weight=numeric(0))
> mydata <- edit(mydata)

四、图形基础
1、生成图形
>"绑定数据框mtcars"
>"打开图形窗口,生成散点图"
>"在图形中加入最优拟合线"
>"添加标题"
>"解除绑定"
>"因解除绑定,所以找不到mtcars"
> attach(mtcars)
> plot(wt,mpg)
> abline(lm(mpg~wt))
> title("Hello R")
> detach(mtcars)
> plot(wt,mpg)
Error in plot(wt, mpg) : 找不到对象'wt'

2、将图像保存到pdf中
> pdf("mygraph.pdf")
> attach(mtcars)
> plot(wt,mpg)
> abline(lm(mpg~wt))
> title("pdf")
> detach(mtcars)
> dev.off()
windows
      2
