import unittest
import matplotlib.pyplot as plt
"""简易散点图"""
class MyTestCase(unittest.TestCase):
def test_something(self):
self.assertEqual(True, False)
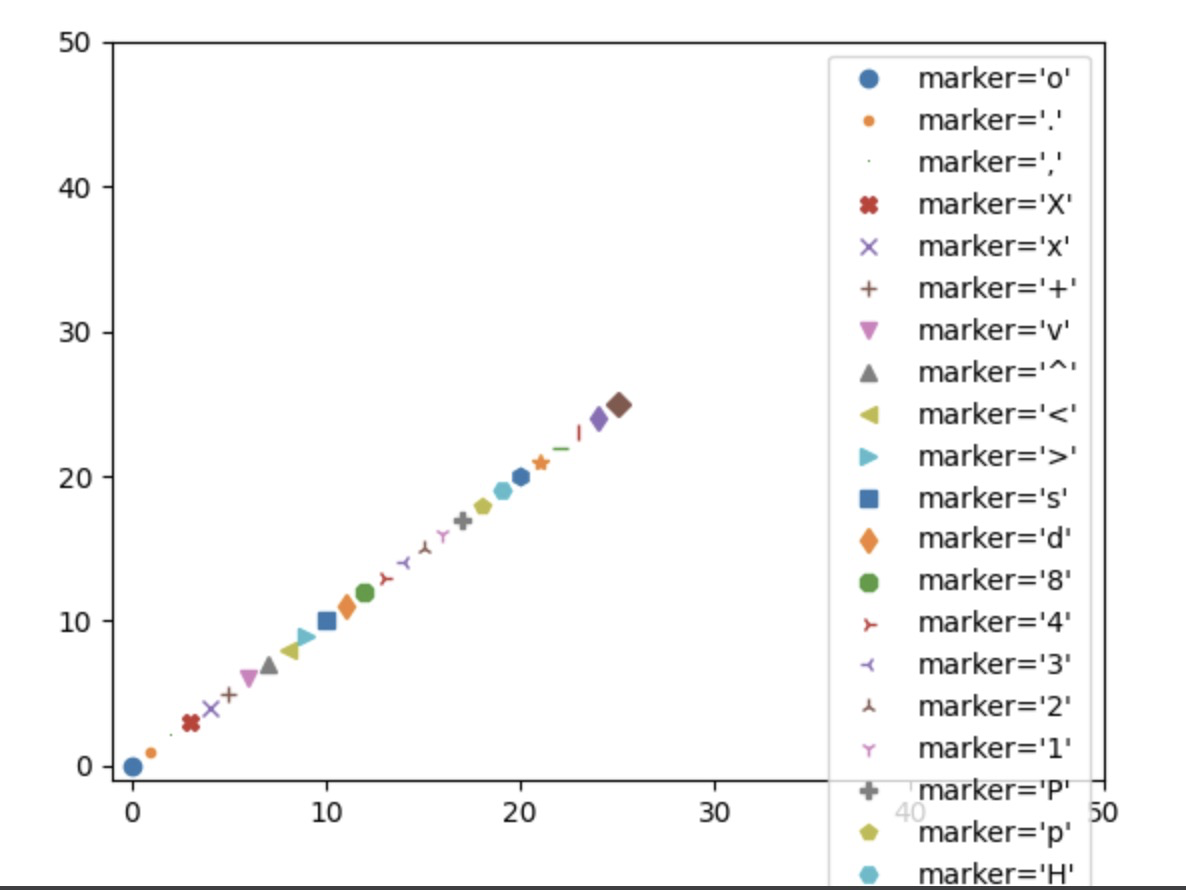
def test_o_01(self):
"""不同坐标类型"""
i = 0
for marker in ['o', '.', ',', 'X', 'x', '+', 'v',
'^', '<', '>', 's', 'd', '8', '4',
'3', '2', '1', 'P', 'p', 'H', 'h',
'*', '_', '|', 'd', 'D']:
plt.plot([i], [i], marker, label="marker='{0}'".format(marker))
i += 1
plt.legend()
plt.xlim(-1, 50)
plt.ylim(-1, 50)
plt.savefig('test_o_01.png')
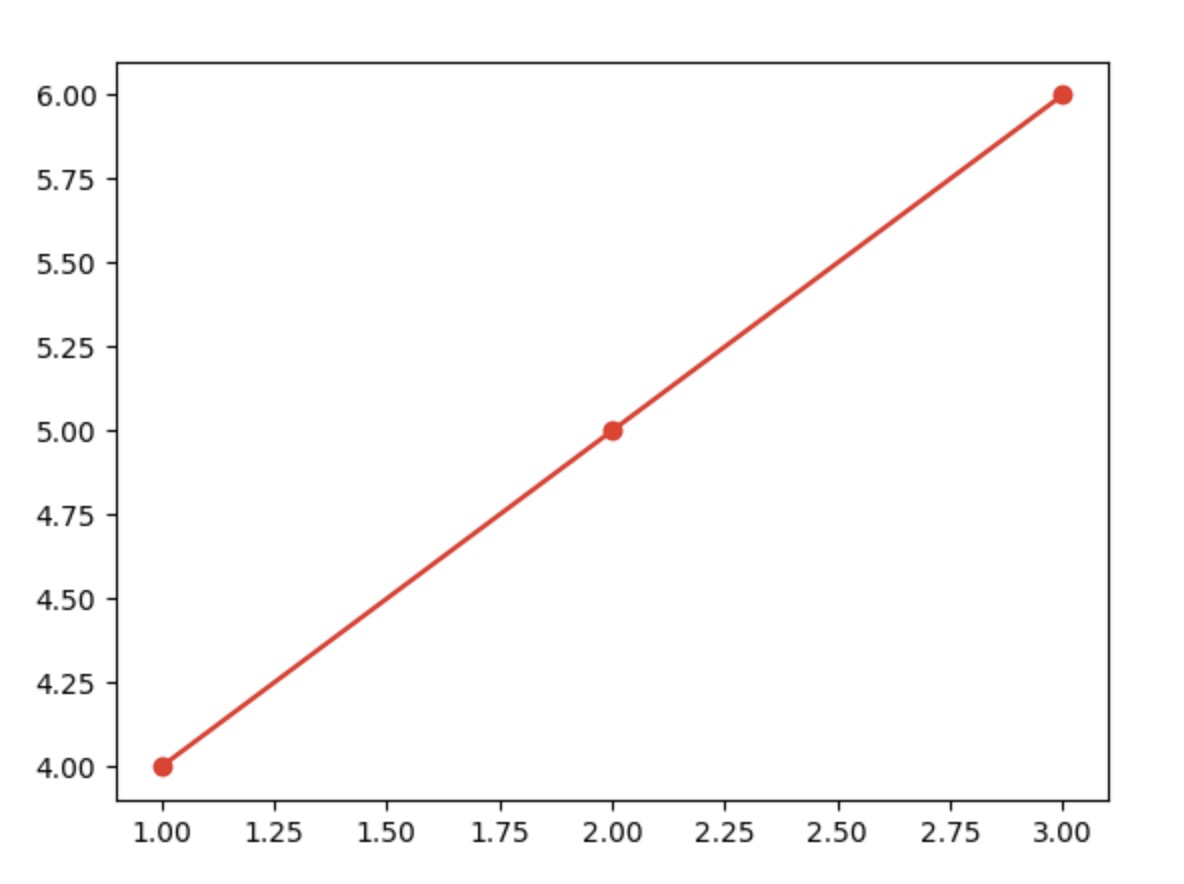
def test_o_02(self):
"""不同图标混合使用"""
plt.plot([1, 2, 3], [4, 5, 6], '-or') # 直线,圆圈,红色
plt.savefig('test_o_02.png')
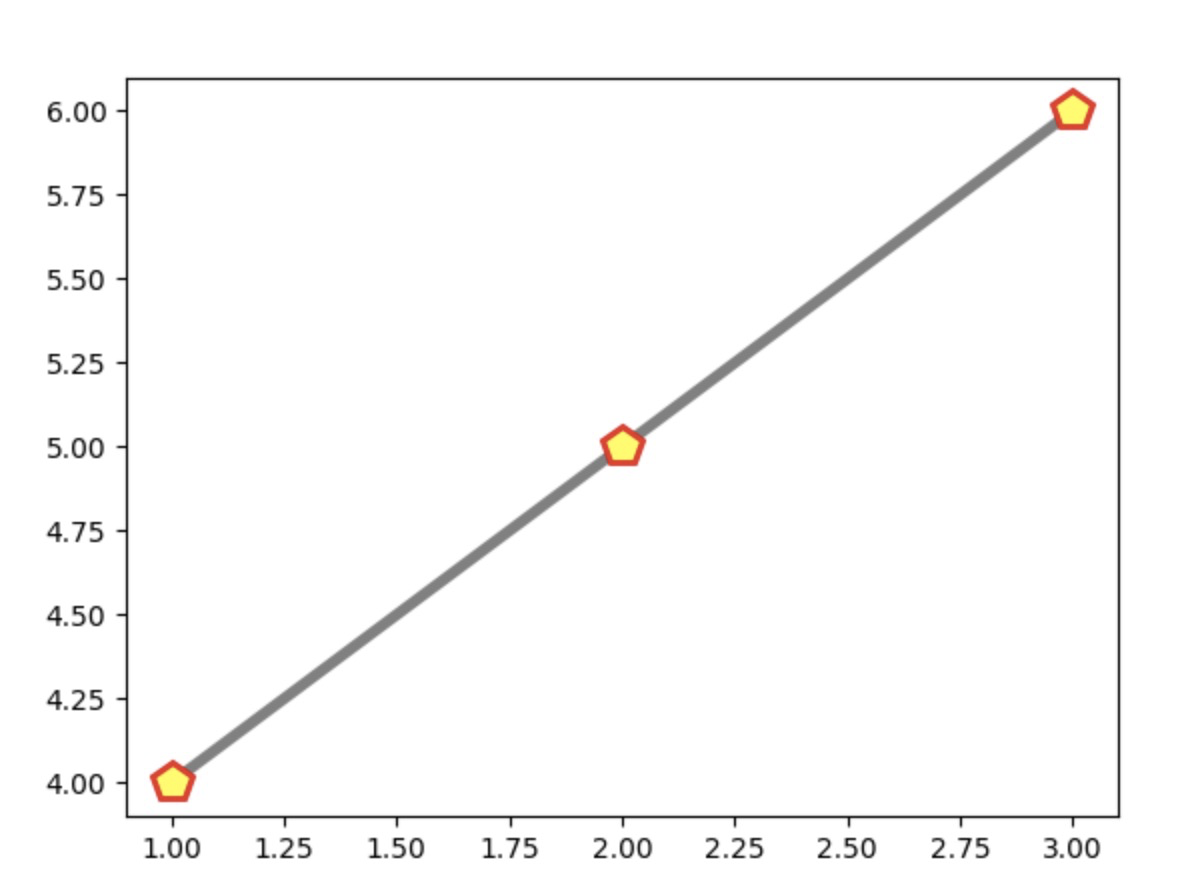
def test_o_03(self):
"""自定义线条和散点属性"""
plt.plot([1, 2, 3], [4, 5, 6], '-p', color='gray',
markersize=15, linewidth=4,
markerfacecolor='yellow', # 标记颜色
markeredgecolor='red', # 标记边缘颜色
markeredgewidth=2)
plt.savefig('test_o_03.png')
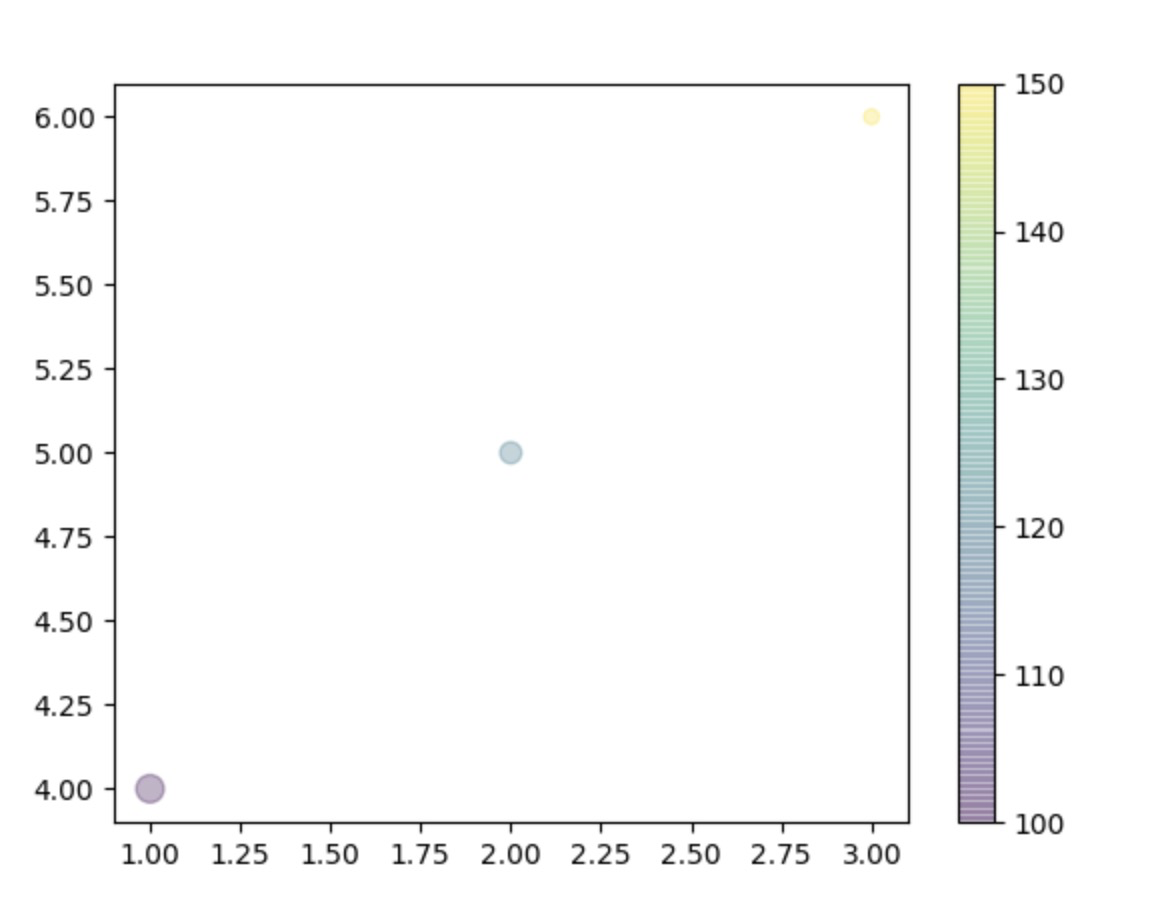
def test_o_04(self):
"""使用scatter画散点图
cmap https://matplotlib.org/tutorials/colors/colormaps.html
"""
plt.scatter([1, 2, 3], [4, 5, 6], c=[100, 120, 150], s=[100, 60, 30], alpha=0.3, cmap='viridis')
plt.colorbar() # 显示颜色条
plt.savefig('test_o_04.png')
if __name__ == '__main__':
unittest.main()
test_o_01.png
test_o_02.png
test_o_03.png
test_o_04.png