Highcharts 简介
Highcharts 是一个用纯JavaScript编写的一个图表库, 能够很简单便捷的在web网站或是web应用程序添加有交互性的图表,并且免费提供给个人学习、个人网站和非商业用途使用。目前HighCharts支持的图表类型有曲线图、区域图、柱状图、饼状图、散状点图和综合图表。
使用
1.引入文件,定义container(图表显示的位置)
<script src="http://ajax.googleapis.com/ajax/libs/jquery/1.8.2/jquery.min.js"></script>
<script src="http://code.highcharts.com/highcharts.js"></script>
<script src="http://code.highcharts.com/modules/exporting.js"></script>  //如果要导出的话,加上这个

<div id="container" style="min- 310px; height: 400px; margin: 0 auto"></div>
2.获取数据,绘制图表
$(function () {
        $('#container').highcharts({
            chart: {
                type: 'column'   //图表的类型
            },
            title: {
                text: 'Monthly Average Rainfall'  //标题
            },
            subtitle: {
                text: 'Source: WorldClimate.com'  //副标题
            },
            xAxis: {                                // x轴坐标
                categories: [
                    'Jan',
                    'Feb',
                    'Mar',
                    'Apr',
                    'May',
                    'Jun',
                    'Jul',
                    'Aug',
                    'Sep',
                    'Oct',
                    'Nov',
                    'Dec'
                ]
            },
            yAxis: {                                          //y轴
                min: 0,
                title: {
                    text: 'Rainfall (mm)'
                }
            },
            tooltip: {                                             // 点击显示效果
                headerFormat: '<span style="font-size:10px">{point.key}</span><table>',
                pointFormat: '<tr><td style="color:{series.color};padding:0">{series.name}: </td>' +
                    '<td style="padding:0"><b>{point.y:.1f} mm</b></td></tr>',
                footerFormat: '</table>',
                shared: true,
                useHTML: true
            },
            plotOptions: {
                column: {
                    pointPadding: 0.2,
                    borderWidth: 0
                }
            },
            series: [{                                              //    具体数据
                name: 'Tokyo',
                data: [49.9, 71.5, 106.4, 129.2, 144.0, 176.0, 135.6, 148.5, 216.4, 194.1, 95.6, 54.4]

            }, {
                name: 'New York',
                data: [83.6, 78.8, 98.5, 93.4, 106.0, 84.5, 105.0, 104.3, 91.2, 83.5, 106.6, 92.3]

            }, {
                name: 'London',
                data: [48.9, 38.8, 39.3, 41.4, 47.0, 48.3, 59.0, 59.6, 52.4, 65.2, 59.3, 51.2]

            }, {
                name: 'Berlin',
                data: [42.4, 33.2, 34.5, 39.7, 52.6, 75.5, 57.4, 60.4, 47.6, 39.1, 46.8, 51.1]

            }]
        });
    });
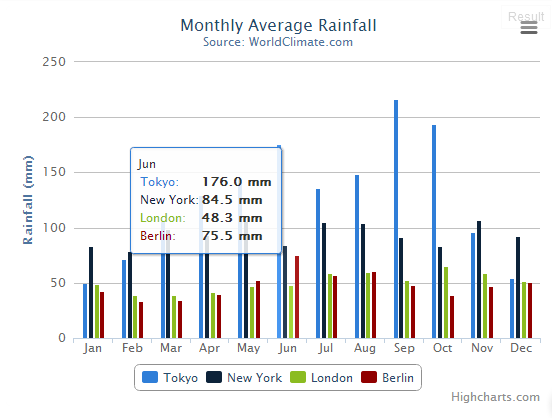
3.效果图
如何去除图表右下角的highcharts.com链接
1.修改highcharts.js文件,搜索“credits”,将把“enable”的属性从true改为false或者 将“text”内容设置为空
2.在highcharts配置中将credits选项设置为”false”,或是修改自己的链接
credits:{
    enabled : false
}

//或者
credits:{
    enabled: true,
    href :”http://blog.csdn.net/stephen_0310”,
    text : “stephen_0310“
}