仪表盘的样式如下:
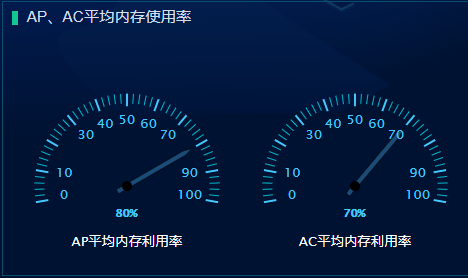
是双表盘展示
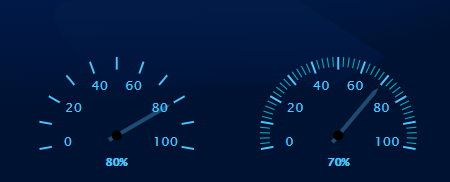
左边的图中minorTickInterval的值为null,右边的minorTickInterval的值为“auto”
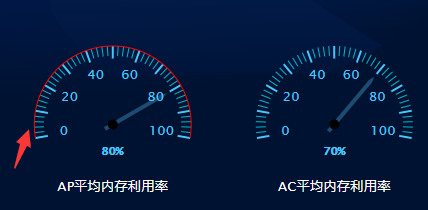
左边的图中lineColor的值为‘#f00’,右边的lineColor的值为“transparent”
yAxis: [{
    min: 0,
    // 最小刻度值
    max: 100,
    // 最大刻度值
    minorTickInterval: 'auto',
    // 表盘中比较短的刻度值
    minorTickWidth: that.torem(2),
    // 表盘中比较短的刻度值的宽度
    minorTickLength: that.torem(20),
    // 表盘中比较短的刻度值的长度
    minorTickPosition: 'inside',
    // 表盘中比较短的刻度值在内部还是在外部显示
    minorTickColor: '#00bfd3',
    // 表盘中比较短的刻度值的颜色
    tickPixelInterval: 'auto',
    // 表盘中比较长的刻度值
    tickWidth: that.torem(4),
    // 表盘中比较长的刻度值的宽度
    tickPosition: 'inside',
    // 表盘中比较长的刻度值在内部还是在外部显示
    tickLength: that.torem(26),
    // 表盘中比较长的刻度值的长度
    tickColor: '#48c7ff',
    // 表盘中比较长的刻度值的颜色
    tickInterval: 10,
    // 间隔
    lineColor: 'transparent',
    // 表盘最外层的连接线
}]
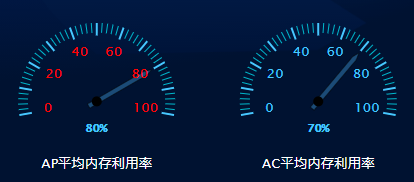
labels: {
    style: { // 刻度值数字的样式
        color: '#f00',
        fontSize: that.torem(28)
        // step: 20
    },
    distance: that.offetY
},
y轴的一些设置
yAxis: [{
    min: 0,
    // 最小刻度值
    max: 100,
    // 最大刻度值
    minorTickInterval: 'auto',
    // 表盘中比较短的刻度值
    minorTickWidth: that.torem(2),
    // 表盘中比较短的刻度值的宽度
    minorTickLength: that.torem(20),
    // 表盘中比较短的刻度值的长度
    minorTickPosition: 'inside',
    // 表盘中比较短的刻度值在内部还是在外部显示
    minorTickColor: '#00bfd3',
    // 表盘中比较短的刻度值的颜色
    tickPixelInterval: 'auto',
    // 表盘中比较长的刻度值
    tickWidth: that.torem(4),
    // 表盘中比较长的刻度值的宽度
    tickPosition: 'inside',
    // 表盘中比较长的刻度值在内部还是在外部显示
    tickLength: that.torem(26),
    // 表盘中比较长的刻度值的长度
    tickColor: '#48c7ff',
    // 表盘中比较长的刻度值的颜色
    tickInterval: 10,
    // 间隔
    lineColor: 'transparent',
    // 表盘最外层的连接线
    labels: {
        style: { // 刻度值数字的颜色
            color: '#48c7ff',
            fontSize: that.torem(28)
            // step: 20
        },
        distance: that.offetY
    },
    pane: 0,
    // 第一个面板,第二个面板是1
    title: { // 描述文字
        text: this.text1,
        verticalAlign: 'bottom',
        style: {
            color: '#fff',
            fontSize: that.torem(28)
        },
        y: that.torem(220) // 离y轴的距离
    }
}, {
    min: 0,
    max: 100,
    minorTickInterval: 'auto',
    minorTickWidth: that.torem(2),
    minorTickLength: that.torem(20),
    minorTickPosition: 'inside',
    minorTickColor: '#00bfd3',
    tickPixelInterval: 30,
    tickWidth: that.torem(4),
    tickPosition: 'inside',
    tickLength: that.torem(26),
    tickColor: '#48c7ff',
    tickInterval: 10,
    // 间隔
    tickmarkPlacement: 'on',
    lineColor: 'transparent',
    labels: {
        style: {
            color: '#48c7ff',
            fontSize: that.torem(28)
        },
        distance: that.offetY
    },
    pane: 1,
    title: {
        text: this.text2,
        verticalAlign: 'bottom',
        style: {
            color: '#fff',
            fontSize: that.torem(28)
        },
        y: that.torem(220)
    }
}],
指针以及表盘内百分比的显示的设置
plotOptions: {
    gauge: {
        dataLabels: {
            borderWidth: 0,
            enabled: true,
            color: '#48c7ff',
            fontSize: that.torem(80),
            format: ` <span> {y} % </span>`
        },
        dial: {
            radius: '80%', // 半径:指针长度
            backgroundColor: '#1b4b77',
            //指针背景色
            borderColor: 'black',
            borderWidth: that.torem(1),
            baseWidth: that.torem(10),
            topWidth: that.torem(1),
            baseLength: '90%',
            // of radius
            rearLength: '15%' //尾巴长度
        },
        borderWidth: 0
    }
},
指针中的百分比值,也就是y轴的初始刻度值
series: [{// 第一个表盘对应的数据
    data: [80],
    yAxis: 0
}, {// 第二个表盘对应的数据
    data: [70],
    yAxis: 1
}]