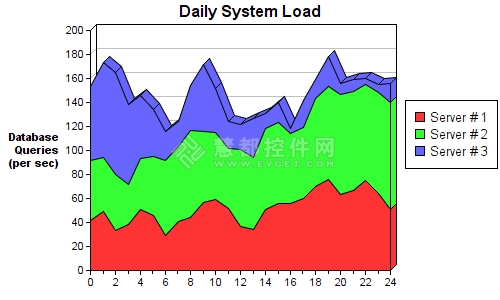
3D堆叠面积图可以显示每个数值所占大小随时间或其他类别数据变化的趋势。但其实它不是真正的三维,因为它没有第三个轴,而只是将平面的面积图以三维透视图的形式显示。下图是用Web图表控件ChartDirector绘制的3D堆叠面积图,展示了三个服务器一天的负载情况:
主要步骤:
- 用Stack的预定义常数XYChart.addAreaLayer2添加一个堆叠面积层
- 用Layer.addDataSet向面积层添加多数据集
- 用BaseChart.addLegend向图表添加一个图例
- 用Axis.setTitle向Y轴添加标题,用TextBox.setFontAngle竖直绘制标题(而不是旋转90度)。注意,可以用换行字符让标题包含多行。
ChartDirector绘制三维堆叠面积图示例代码:
|
1
2
3
4
5
6
7
8
9
10
11
12
13
14
15
16
17
18
19
20
21
22
23
24
25
26
27
28
29
30
31
32
33
34
35
36
37
38
39
40
41
42
43
44
45
46
47
48
49
50
51
52
53
54
55
56
57
58
59
|
#include "chartdir.h"int main(int argc, char *argv[]){ // The data for the area chart double data0[] = {42, 49, 33, 38, 51, 46, 29, 41, 44, 57, 59, 52, 37, 34, 51, 56, 56, 60, 70, 76, 63, 67, 75, 64, 51}; double data1[] = {50, 45, 47, 34, 42, 49, 63, 62, 73, 59, 56, 50, 64, 60, 67, 67, 58, 59, 73, 77, 84, 82, 80, 84, 89}; double data2[] = {61, 79, 85, 66, 53, 39, 24, 21, 37, 56, 37, 22, 21, 33, 13, 17, 4, 23, 16, 25, 9, 10, 5, 7, 16}; const char *labels[] = {"0", "1", "2", "3", "4", "5", "6", "7", "8", "9", "10", "11", "12", "13", "14", "15", "16", "17", "18", "19", "20", "21", "22", "23", "24"}; // Create a XYChart object of size 500 x 300 pixels XYChart *c = new XYChart(500, 300); // Set the plotarea at (90, 30) and of size 300 x 240 pixels. c->setPlotArea(90, 30, 300, 240); // Add a legend box at (405, 100) c->addLegend(405, 100); // Add a title to the chart c->addTitle("Daily System Load"); // Add a title to the y axis. Draw the title upright (font angle = 0) c->yAxis()->setTitle("Database\nQueries\n(per sec)")->setFontAngle(0); // Set the labels on the x axis. c->xAxis()->setLabels(StringArray(labels, (int)(sizeof(labels) / sizeof(labels[0] )))); // Display 1 out of 2 labels on the x-axis. Show minor ticks for remaining // labels. c->xAxis()->setLabelStep(2, 1); // Add an area layer AreaLayer *layer = c->addAreaLayer(); // Draw the area layer in 3D layer->set3D(); // Add the three data sets to the area layer layer->addDataSet(DoubleArray(data0, (int)(sizeof(data0) / sizeof(data0[0]))), -1, "Server # 1"); layer->addDataSet(DoubleArray(data1, (int)(sizeof(data1) / sizeof(data1[0]))), -1, "Server # 2"); layer->addDataSet(DoubleArray(data2, (int)(sizeof(data2) / sizeof(data2[0]))), -1, "Server # 3"); // Output the chart c->makeChart("threedstackarea.png"); //free up resources delete c; return 0;} |