numpy 模块 impotr numpy as np
作用:
1.区别于list列表,提供了数组操作、数组运算、以及统计分布和简单的数学模型
2.计算速度快,甚至要由于python内置的简单运算,使得其成为pandas、sklearn等模块的依赖包。高级的框架如TensorFlow、PyTorch等,其数组操作也和numpy非常相似。
创建numpy 数组
一维数组:
arr = np.array([1, 2, 4])
print(type(arr), arr)
<class 'numpy.ndarray'> [1 2 4]
二维数组:
arr = np.array([
    [1, 2, 3],
    [4, 5, 6]
])
print(arr)
[[1 2 3]
 [4 5 6]]
三维数组:
arr3 = np.array([
    [[1, 2, 3],
     [4, 5, 6]],
    [[1, 2, 3],
     [4, 5, 6]],
])
print(arr3)
[[[1 2 3] [4 5 6]]
[[1 2 3] [4 5 6]]]
数组的转置:行与列互换
arr = np.array([
    [1, 2, 3],
    [4, 5, 6]
])

# T    数组的转置(对高维数组而言) --> 行列互换,转置
print(arr, '
', arr.T)

[[1 2 3]
 [4 5 6]]
 [[1 4]
 [2 5]
 [3 6]]
dtype 数组元素的数据类型
# dtype    数组元素的数据类型,numpy数组是属于python解释器的;int32/float64属于numpy的  32  64  表示计算机显示的最高长度
print(arr.dtype)   # int32
size 数组元素的个数
print(arr.size) # 6
ndim 数组的维数
print(arr.ndim)    # 2
print(arr3.ndim)   #  3
shape 数组的维度大小(以元祖的形式)几行,几列
print (arr.shape) #  (2,3)
print(arr.shape[0]) # 拿到特定集合 表示有多少行  2
print(arr.shape[1])  #表示有多少列             3
astype 类型转换
arr = arr.astype(np.float64)
print(arr)

[[1. 2. 3.]
 [4. 5. 6.]]
切片numpy数组
arr = np.array([
    [1, 2, 3],
    [4, 5, 6]
])

print(arr[:, :])  # 行,列

print(arr[0, 0]) #第一行第一列  1

print(arr[0, :])  #第一行所有元素  [1, 2, 3]

print(arr[:, -2:])  # 最后两列 [[2 3]
                              [5 6]]
逻辑取值
print(arr[arr > 2]) 取出所有大于4的元素 # [3,4,5,6]
赋值
arr = np.array([
    [1, 2, 3],
    [4, 5, 6]
])

arr[0, 0] = 0  第一行第一个边为0
print(arr)

arr[0, :] = 0  第一行都为0
print(arr)

arr[:, :] = 0  所有的都为0
print(arr)
数组的合并
# 数组的合并

arr1 = np.array([
    [1, 2, 3],
    [4, 5, 6]
])

arr2 = np.array([
    [7, 8, 9],
    ['a', 'b', 'c']
])

print(np.hstack((arr1, arr2)))  # 只能放元组  水平合并 [['1' '2' '3' '7' '8' '9']
                                                     ['4' '5' '6' 'a' 'b' 'c']]


print(np.vstack((arr1, arr2)))  #  垂直合并
                      [['1' '2' '3']
                      ['4' '5' '6']
                      ['7' '8' '9']
                      ['a' 'b' 'c']]
print(np.concatenate((arr1, arr2), axis=1))  # 默认以列合并 # 0表示列,1表示行
通过函数创建numpy函数
print(np.ones((2, 3))) 创建2行3列的元素都为1的数组
[[1. 1. 1.]
 [1. 1. 1.]]


print(np.zeros((2, 3))) 创建2行3列的元素都为0的数组
[[0. 0. 0.]
 [0. 0. 0.]]

print(np.eye(3, 3))    创建3行3列的单位矩阵
[[1. 0. 0.]
 [0. 1. 0.]
 [0. 0. 1.]]

print(np.linspace(1, 100, 10)) 开始,停止,多少个
[  1.  12.  23.  34.  45.  56.  67.  78.  89. 100.]

print(np.arange(2, 10))
 [2 3 4 5 6 7 8 9]  # 只能创一维的

arr1 = np.zeros((1, 12))
print(arr1.reshape((3, 4)))  # 把arr1重构形状(元素个数不变)
numpy 数组运算
# +-*'
arr1 = np.ones((3, 4)) * 4
print(arr1)
[[4. 4. 4. 4.] [4. 4. 4. 4.] [4. 4. 4. 4.]]
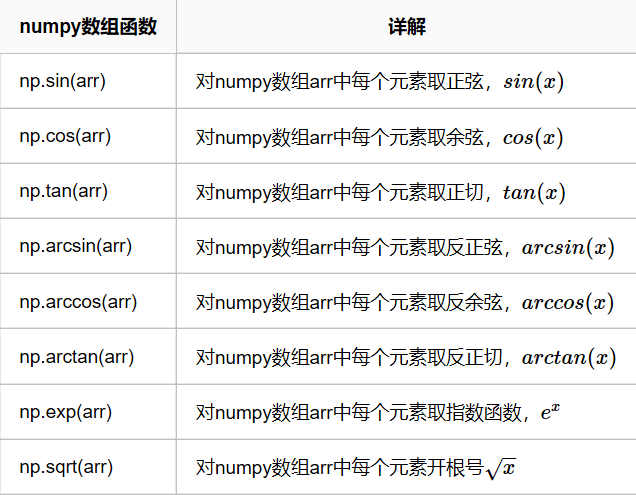
# numpy数组运算函数 print(np.sin(arr1)) #对数组里面的元素正弦
[[-0.7568025 -0.7568025 -0.7568025 -0.7568025]
[-0.7568025 -0.7568025 -0.7568025 -0.7568025]
[-0.7568025 -0.7568025 -0.7568025 -0.7568025]]
# 矩阵运算--点乘 arr1 = np.array([ [1, 2, 3], [4, 5, 6] ]) arr2 = np.array([ [1, 2], [4, 5], [6, 7] ]) # 2* 3 3*2 print(np.dot(arr1, arr2)) [[27 33]
[60 75]]
# 求逆 arr = np.array([[1, 2, 3], [4, 5, 6], [9, 8, 9]]) print(np.linalg.inv(arr)) [[ 0.5 -1. 0.5 ]
[-3. 3. -1. ]
[ 2.16666667 -1.66666667 0.5 ]]
# numpy数组数学和统计方法 print(np.sum(arr[0, :])) #把第1行的元素求和
6
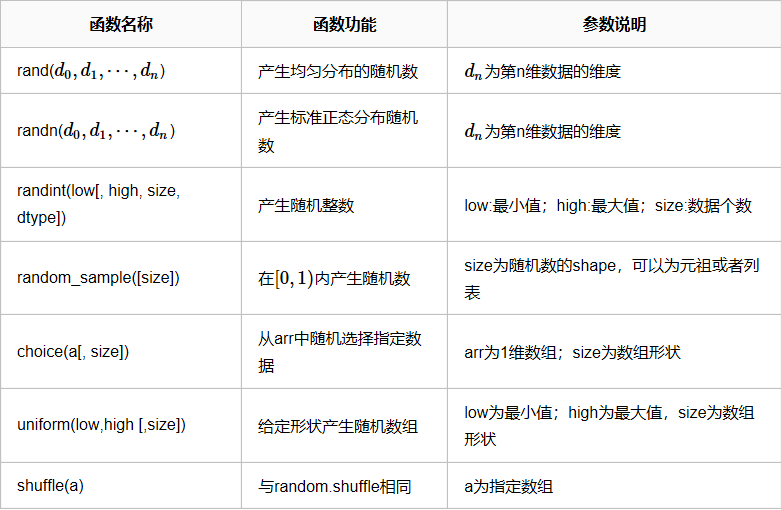
# numpy.random生成随机数(******) print(np.random.rand(3, 4))
随机生成3行4列的数,符合正态分布0-1 print(np.random.random((3, 4))) 随机数3行4列,完全随机0-1
# 针对某一个范围
print(np.random.randint(1, 100, (3, 4)))
[[40 81 62 79]
[26 59 94 90]
[16 82 84 43]]
# np.random.seed(1)控制下面的数据,永久不随机 print(np.random.random((3, 4))) s = np.random.RandomState(1) 等同于上面的seed(),控制不随机 print(s.random((3, 4))) arr = np.array([[1, 2, 3], [4, 5, 6], [9, 8, 9]]) np.random.shuffle(arr)洗牌,随机 print(arr) [[9 8 9]
[1 2 3]
[4 5 6]]
# 针对一维 print(np.random.choice([1, 2, 3], 1))随机取出一个
3
总结:
| 属性 | 解释 |
|---|---|
| T | 数组的转置(对高维数组而言) |
| dtype | 数组元素的数据类型 |
| size | 数组元素的个数 |
| ndim | 数组的维数 |
| shape | 数组的维度大小(以元组形式) |
| astype | 类型转换 |
| 方法 | 详解 |
|---|---|
| array() | 将列表转换为数组,可选择显式指定dtype |
| arange() | range的numpy版,支持浮点数 |
| linspace() | 类似arange(),第三个参数为数组长度 |
| zeros() | 根据指定形状和dtype创建全0数组 |
| ones() | 根据指定形状和dtype创建全1数组 |
| eye() | 创建单位矩阵 |
| empty() | 创建一个元素全随机的数组 |
| reshape() | 重塑形状 |
| 运算符 | 说明 |
|---|---|
| + | 两个numpy数组对应元素相加 |
| - | 两个numpy数组对应元素相减 |
| * | 两个numpy数组对应元素相乘 |
| / | 两个numpy数组对应元素相除,如果都是整数则取商 |
| % | 两个numpy数组对应元素相除后取余数 |
| **n | 单个numpy数组每个元素都取n次方,如**2:每个元素都取平方 |
| 方法 | 详解 |
|---|---|
| sum | 求和 |
| cumsum | 累加求和 |
| mean | 求平均数 |
| std | 求标准差 |
| var | 求方差 |
| min | 求最小值 |
| max | 求最大值 |
| argmin | 求最小值索引 |
| argmax | 求最大值索引 |
| sort | 排序 |
matpottlib模块 画图
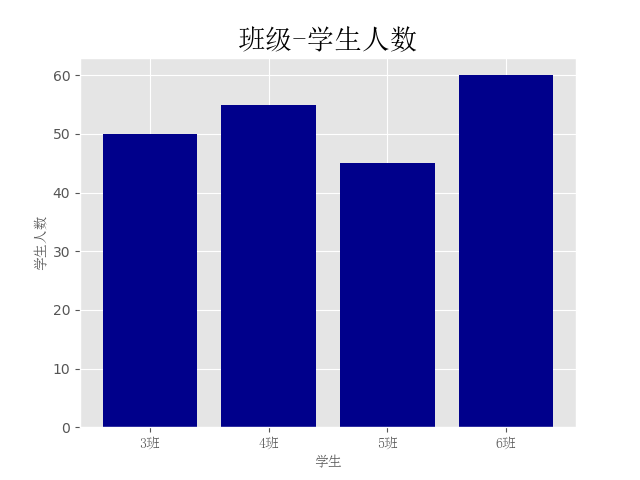
条形图:
from matplotlib import pyplot as plt
from matplotlib.font_manager import FontProperties
font = FontProperties(fname='C:WindowsFontssimsun.ttc')
plt.style.use('ggplot')  # 设置背景

clas = ['3班', '4班', '5班', '6班']
students = [50, 55, 45, 60]
clas_index = range(len(clas))

# [0,1,2,3] [50,55,45,60]
plt.bar(clas_index,students,color='darkblue')

plt.xlabel('学生',fontproperties=font)
plt.ylabel('学生人数',fontproperties=font)
plt.title('班级-学生人数',fontproperties=font,fontsize=20,fontweight=25)
plt.xticks(clas_index,clas,fontproperties=font)

plt.show()
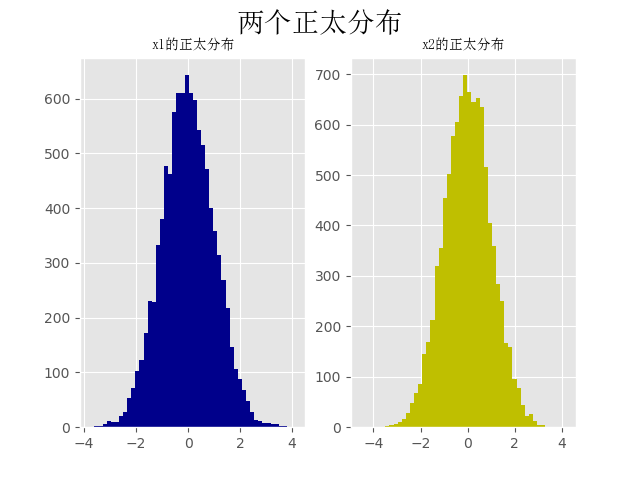
直方图:
import numpy as np
from matplotlib import pyplot as plt # 约定俗成
from matplotlib.font_manager import FontProperties # 修改字体
font = FontProperties(fname='C:WindowsFontssimsun.ttc')
import numpy as np
from matplotlib import pyplot as plt  # 约定俗成
from matplotlib.font_manager import FontProperties  # 修改字体

font = FontProperties(fname='C:WindowsFontssimsun.ttc')

plt.style.use('ggplot')

x1 = np.random.randn(10000)

x2 = np.random.randn(10000)

fig = plt.figure()  # 生成一张画布
ax1 = fig.add_subplot(1, 2, 1)  # 1行2列取第一个
ax2 = fig.add_subplot(1, 2, 2)

ax1.hist(x1, bins=50,color='darkblue')
ax2.hist(x2, bins=50,color='y')

fig.suptitle('两个正太分布',fontproperties=font,fontsize=20)
ax1.set_title('x1的正太分布',fontproperties=font)  # 加子标题
ax2.set_title('x2的正太分布',fontproperties=font)
plt.show()
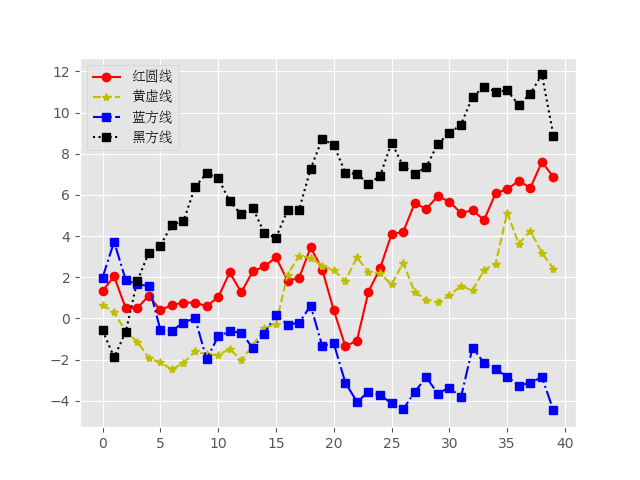
折线图:
import numpy as np
from matplotlib import pyplot as plt # 约定俗成
from matplotlib.font_manager import FontProperties # 修改字体
font = FontProperties(fname='C:WindowsFontssimsun.ttc')
import numpy as np
from matplotlib import pyplot as plt  # 约定俗成
from matplotlib.font_manager import FontProperties  # 修改字体

font = FontProperties(fname='C:WindowsFontssimsun.ttc')

plt.style.use('ggplot')

np.random.seed(10)
x1 = np.random.randn(40).cumsum()
x2 = np.random.randn(40).cumsum()
x3 = np.random.randn(40).cumsum()
x4 = np.random.randn(40).cumsum()

plt.plot(x1, c='r', linestyle='-', marker='o', label='红圆线')
plt.plot(x2, color='y', linestyle='--', marker='*', label='黄虚线')
plt.plot(x3, color='b', linestyle='-.', marker='s', label='蓝方线')
plt.plot(x4, color='black', linestyle=':', marker='s', label='黑方线')
plt.legend(loc='best', prop=font)  # 显示label
plt.show()
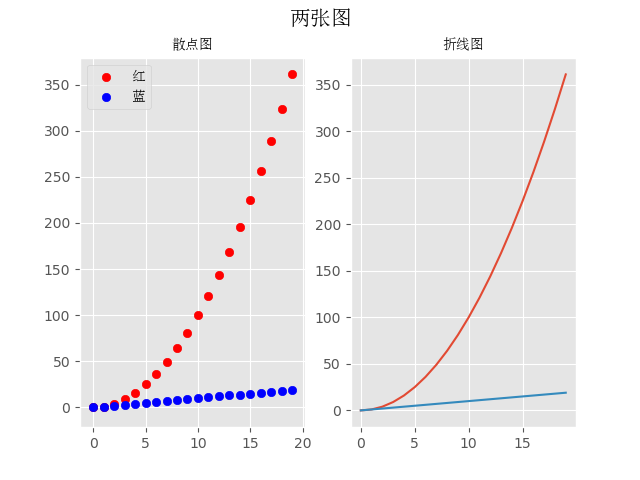
散点图+直线图:
import numpy as np
from matplotlib import pyplot as plt # 约定俗成
from matplotlib.font_manager import FontProperties # 修改字体
font = FontProperties(fname='C:WindowsFontssimsun.ttc')
import numpy as np
from matplotlib import pyplot as plt  # 约定俗成
from matplotlib.font_manager import FontProperties  # 修改字体

font = FontProperties(fname='C:WindowsFontssimsun.ttc')

plt.style.use('ggplot')

fig = plt.figure()
ax1 = fig.add_subplot(1, 2, 1)
ax2 = fig.add_subplot(1, 2, 2)

x = np.arange(20)
y = x ** 2

x2 = np.arange(20)
y2 = x2

ax1.scatter(x, y, c='r', label='红')
ax1.scatter(x2, y2, c='b', label='蓝')

ax2.plot(x, y)
ax2.plot(x2, y2)

fig.suptitle('两张图', fontproperties=font, fontsize=15)
ax1.set_title('散点图', fontproperties=font)
ax2.set_title('折线图', fontproperties=font)
ax1.legend(prop=font)
plt.show()
pandas模块:import panda as pd
操作excel/json/sql/ini/csv(配置文件)/
import pandas as pd
df = pd.read_csv('test.csv',header=None)
df.to_excel('test.xls')
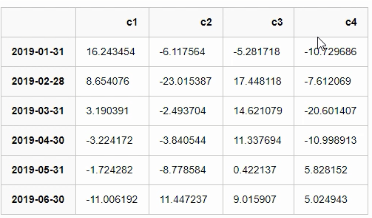
pandas 操作excle文件,从excel 中读取DataFrame数据类型
import numpy as np
import pandas as pd

np.random.seed(10)

index = pd.date_range('2019-01-01', periods=6, freq='M')
print(index)
columns = ['c1', 'c2', 'c3', 'c4']
print(columns)
val = np.random.randn(6, 4)  #6行4列
print(val)

df = pd.DataFrame(index=index, columns=columns, data=val)
print(df)

# 保存文件,读出成文件
df.to_excel('date_c.xlsx')

# 读出文件
df = pd.read_excel('date_c.xlsx', index_col=[0])  #索引定为第一列
print(df)

print(df.index)  # 打印索引
print(df.columns) # 打印专栏
print(df.values)  #打印 值

print(df[['c1', 'c2']]) 按照c1 c2列取值

# 按照index取值
# print(df['2019-01-31'])错误方法
print(df.loc['2019-01-31'])
print(df.loc['2019-01-31':'2019-05-31'])

# 按照values取值
print(df)
print(df.iloc[0, 0])  # 取数据里面的第一行第一列个

df.iloc[0, :] = 0  # 修改值
print(df)