监控形式
对于prometheus监控模式来说主要由以下两种形式:
第一种形式:
- exporter虽然已经很强大,采集的数据已经很丰富了,但是我们依然需要很多自定义的监控数据
- exporter采集数据量庞大,其实很多数据我们基本用不到,那么对于机器性能来说也是一种资源浪费
第二种形式:
- 一个新的pushgateway脚本开发,远远要比一个全新的exporter要简单的多!(exporter开发需要使用真正的变成语言,如python,java,ruby等,而shell脚本是不行的)
- exporter虽然已经很丰富了,但是依然有很多的我们需要的采集形式,exporter无法提供,或者说暂时不支持,但是pushgateway的形式,就可以很灵活,想做什么都可以做到,而且极快

监控分类
- 业务监控:可以包含用户访问QPS,DAU日志,访问状态,业务接口,产品转化率,充值额度,用户投诉等等,这些宏观概念
- 系统监控:主要是跟操作系统相关的基本监控项cpu/内存/硬盘/IO/TCP连接/流量等等
- 网络监控:对于网络状态的监控,互联网公司必不可少,但是很多时候容易被忽略,如:丢包率,延迟等
- 日志监控:监控中的重头戏,往往单独设计和搭建,全部种类的日志都需要有采集
- 程序监控:一般需要配合研发人员,程序中嵌入各种接口,直接获取数据,或者日志格式
数据类型
- Gauges:最简单的度量指标,只有一个简单的返回值,或者叫瞬时状态,例如:我们想衡量一个待处理队列中任务的个数用简单的方式举个例子。如果我们要监控硬盘容量或者内存的使用量,那么就该使用Gauges的metrics格式来度量,因为硬盘的容量或者内存的使用量是随着时间的推移不断的瞬时没有规则变化的,这种变化没有规律,当前是多少,采集回来的数据就是多少,既不能肯定一直增长,也不能肯定一直降低,这就叫做Gauges类型
- Counter:Counter就是计数器,从数据量0开始计算,在理想状态想,只能是永远的增长,不会降低,举个例子:比如对用户访问量的采样数据
安装和下载
想要安装下载prometheus可以到官网上去下载:https://prometheus.io/download/
想要运行prometheus server只需要进入到安装包执行bash prometheus就可以了,然后访问http:serverIP:9090如下:
docker安装prometheus
安装prometheus server
docker run -d -p 9090:9090 -v /root/prometheus.yml:/etc/prometheus/prometheus.yml -v "/etc/localtime:/etc/localtime" --name prometheus prom/prometheus
/root/prometheus.yml内容如下
# my global config
global:
  scrape_interval:     15s # Set the scrape interval to every 15 seconds. Default is every 1 minute.
  evaluation_interval: 15s # Evaluate rules every 15 seconds. The default is every 1 minute.
  # scrape_timeout is set to the global default (10s).

# Alertmanager configuration
alerting:
  alertmanagers:
  - static_configs:
    - targets:
      # - alertmanager:9093

# Load rules once and periodically evaluate them according to the global 'evaluation_interval'.
rule_files:
  # - "first_rules.yml"
  # - "second_rules.yml"

# A scrape configuration containing exactly one endpoint to scrape:
# Here it's Prometheus itself.
scrape_configs:
  # The job name is added as a label `job=<job_name>` to any timeseries scraped from this config.
  - job_name: 'prometheus'

    # metrics_path defaults to '/metrics'
    # scheme defaults to 'http'.

    static_configs:
    - targets: ['localhost:9090']
  - job_name: 'docker'
    - targets: ['192.168.254.16:8080']
安装cadvisor
docker run -d --volume=/:/rootfs:ro --volume=/var/run:/var/run:rw --volume=/sys:/sys:ro --volume=/var/lib/docker/:/var/lib/docker:ro --publish=8080:8080 --detach=true --name=cadvisor --net=host -v "/etc/localtime:/etc/localtime" google/cadvisor:latest
安装grafana
docker run -d -i -p 3000:3000 -v "/etc/localtime:/etc/localtime" -e "GF_SERVER_ROOT_URL=http://grafana.server.name" -e "GF_SECURITY_ADMIN_PASSWORD=admin8888" --net=host grafana/grafana
下载grafana模板
https://grafana.com/grafana/dashboards/11558(也可以下载别的模板)
浏览器打开grafana

pushgateway安装和配置
可以在任意一台机器上部署pushgateway
docker run -d -p 9091:9091 prom/pushgateway
在prometheus server端添加如下:

自定义脚本并发送给pushgateway
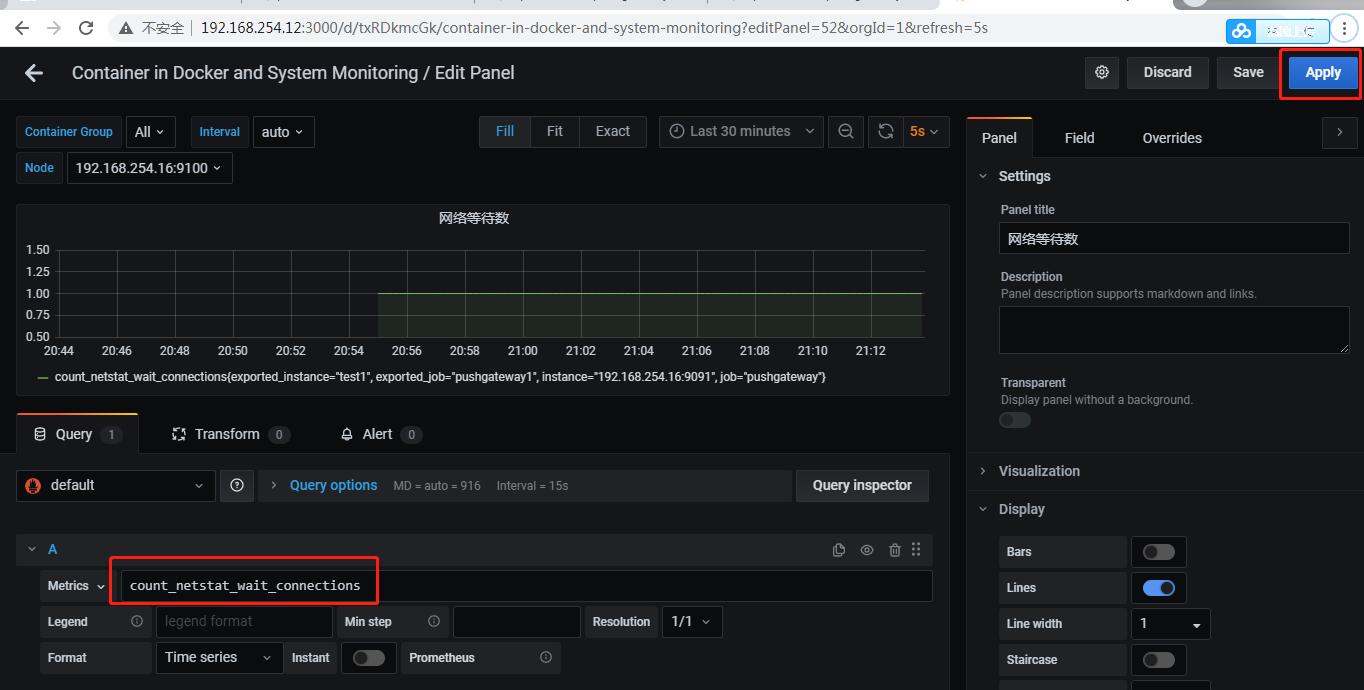
[root@192 ~]# vim node_exporter.sh
instance='test1'
label="count_netstat_wait_connections"
count_netstat_wait_connections=`netstat -an | grep -i wait | wc -l`
echo $count_netstat_wait_connections

echo "$label $count_netstat_wait_connections" | curl --data-binary @- http://192.168.254.16:9091/metr
ics/job/pushgateway1/instance/$instance
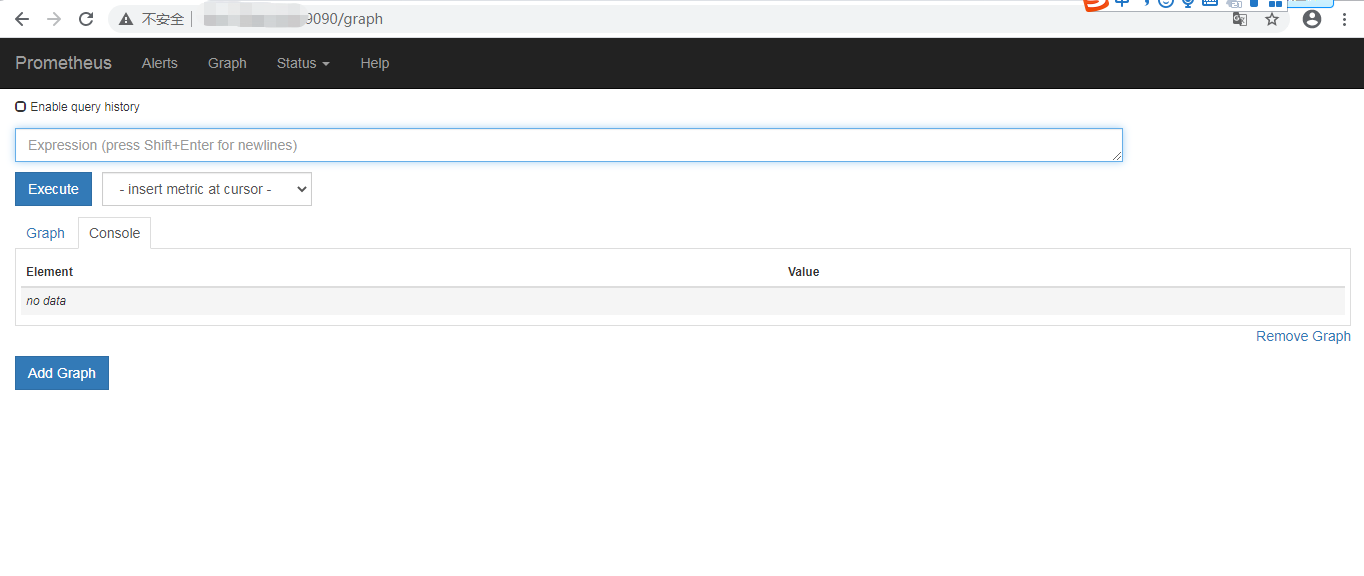
我们可以打开prometheus server查询我们定义的key

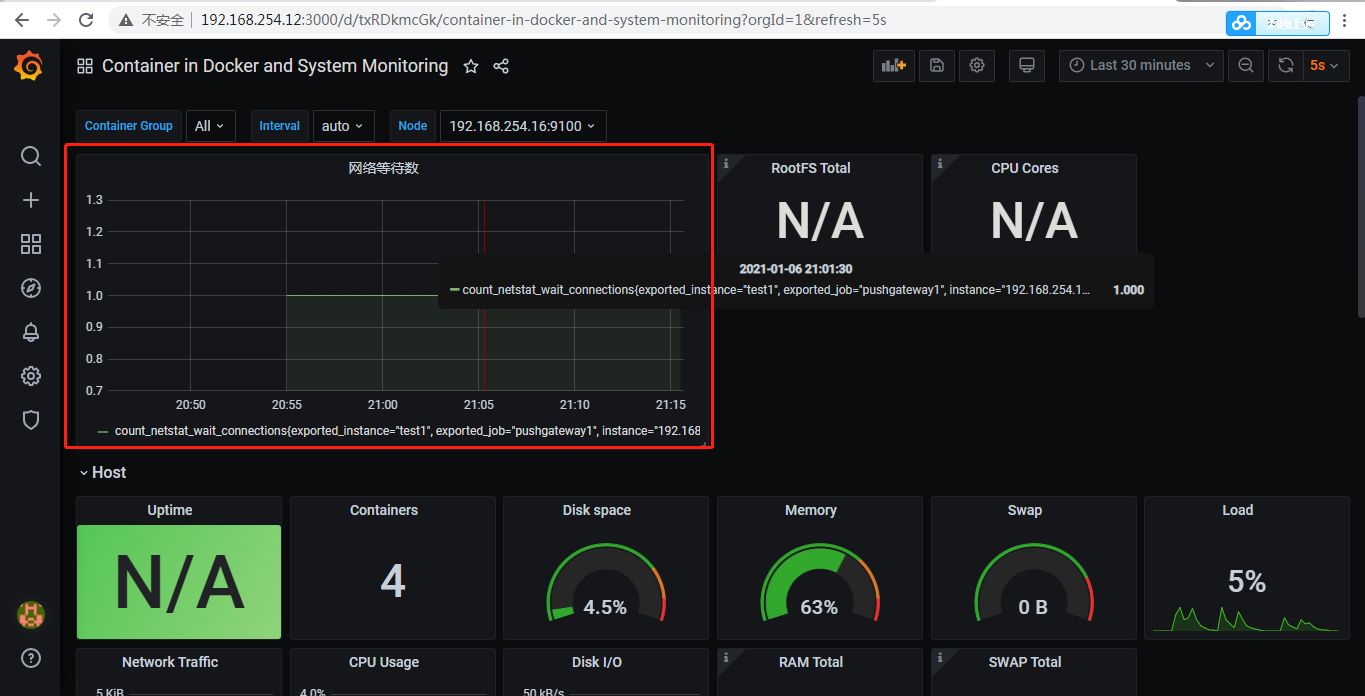
我们可以在grafana下面去添加一个监控面板 ,把我们刚才需要监控的数值监控起来