Prometheus(普罗米修斯) 监控Mysql数据库:
这个是基于第一版本环境搭建的,需要部署prometheus:
服务器                            IP地址
Prometheus服务器                  192.168.1.22
被监控服务器(MySQL)              192.168.1.20
grafana服务器                     192.168.1.21
在被管理机angent1上安装mysqld_exporter组件
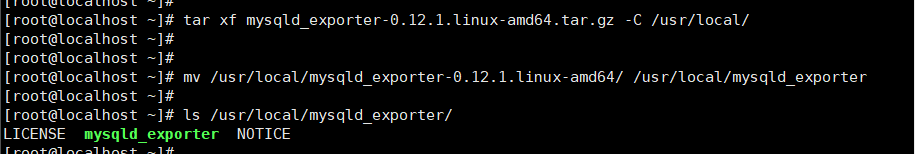
#下载链接:
wget -c https://github.com/prometheus/mysqld_exporter/releases/download/v0.12.1/mysqld_exporter-0.12.1.linux-amd64.tar.gz
#解压:
tar xf mysqld_exporter-0.12.1.linux-amd64.tar.gz -C /usr/local/
mv /usr/local/mysqld_exporter-0.12.1.linux-amd64.tar.gz /usr/local/mysqld_exporter
ls /usr/local/mysqld_exporter
安装mariadb数据库,并授权:
#安装/启动:
yum install mariadb* -y
systemctl restart mariadb
systemctl enable mariadb
mysql

#授权:
MariaDB [(none)]> grant select,replication client,process ON *.* to 'mysql_monitor'@'localhost' identified by '123456';
MariaDB [(none)]> flush privileges;
MariaDB [(none)]> quit

 注意:
 授权IP为localhost,因为不是Prometheus服务器来直接找mariadb获取数据,
 而是Prometheus服务器找mysql_exporter,mysql_exporter再找mariadb.
 所以这个localhost是指mysql_exporter的IP

创建一个mariadb配置文件,写上连接的用户名与密码(和上面的授权的用户名和密码要对应):vim /usr/local/mysqld_exproter/.my.cnf
[client]
user=mysql_monitor
password=123456


#启动mysql_exporter:
nohup /usr/local/mysqld_exporter/mysqld_exporter --config.my-cnf=/usr/local/mysql_exporter/.my.cnf &
#确认端口:
ss -anltp | grep 9104


回到Prometheus服务器的配置文件李添加被监控mariadb的配置段:
在主配置文件最后再加上下面三行:vim /usr/local/prometheus/prometheus.yml
 - jod_name: 'mariadb'                     #取一个jod,名称来代表被监控的mariadb
   static_configs:
   - targets: ['192.168.1.20:9104']        #这里改成,被监控机器的IP,后端接口接9104

改完配置文件后,重启服务:
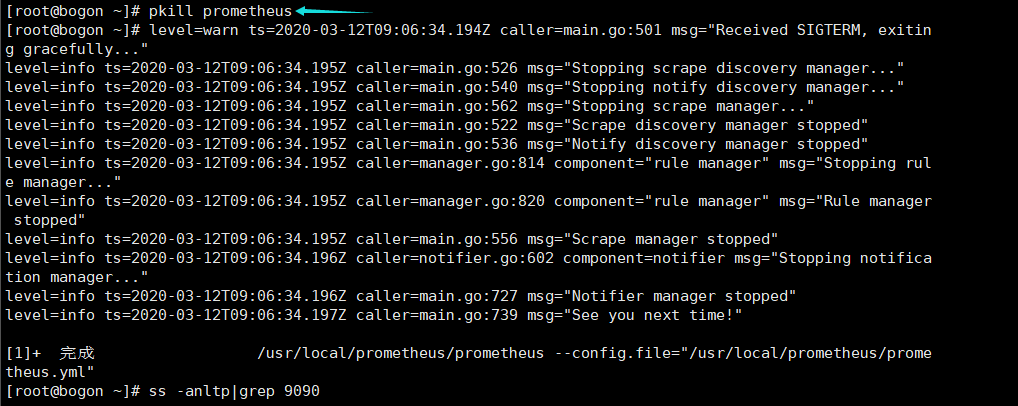
#直接pkill:
pkill prometheus

#重新启动:
/usr/local/prometheus/prometheus --config.file="/usr/local/prometheus/prometheus.yml" &

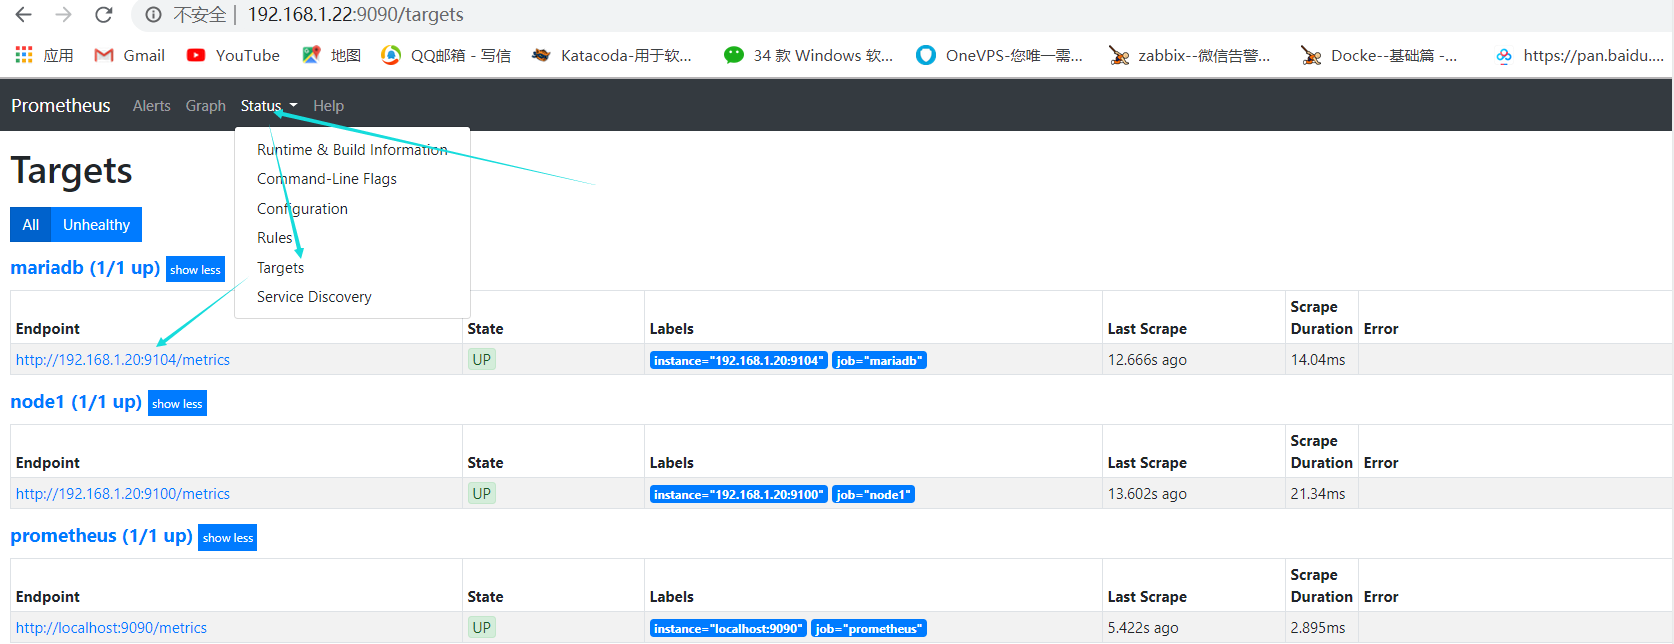
回到web管理界面 --> 点Status-->Targets-->可以看到监控 mariadb了