关于使用echarts走过的坑(同grid多图、多轴系列)

相信大家在工作中,经常会用到echarts,今天我说下我在工作中浪费时间较长的坑

先来看看我的终极需要实现的图吧:

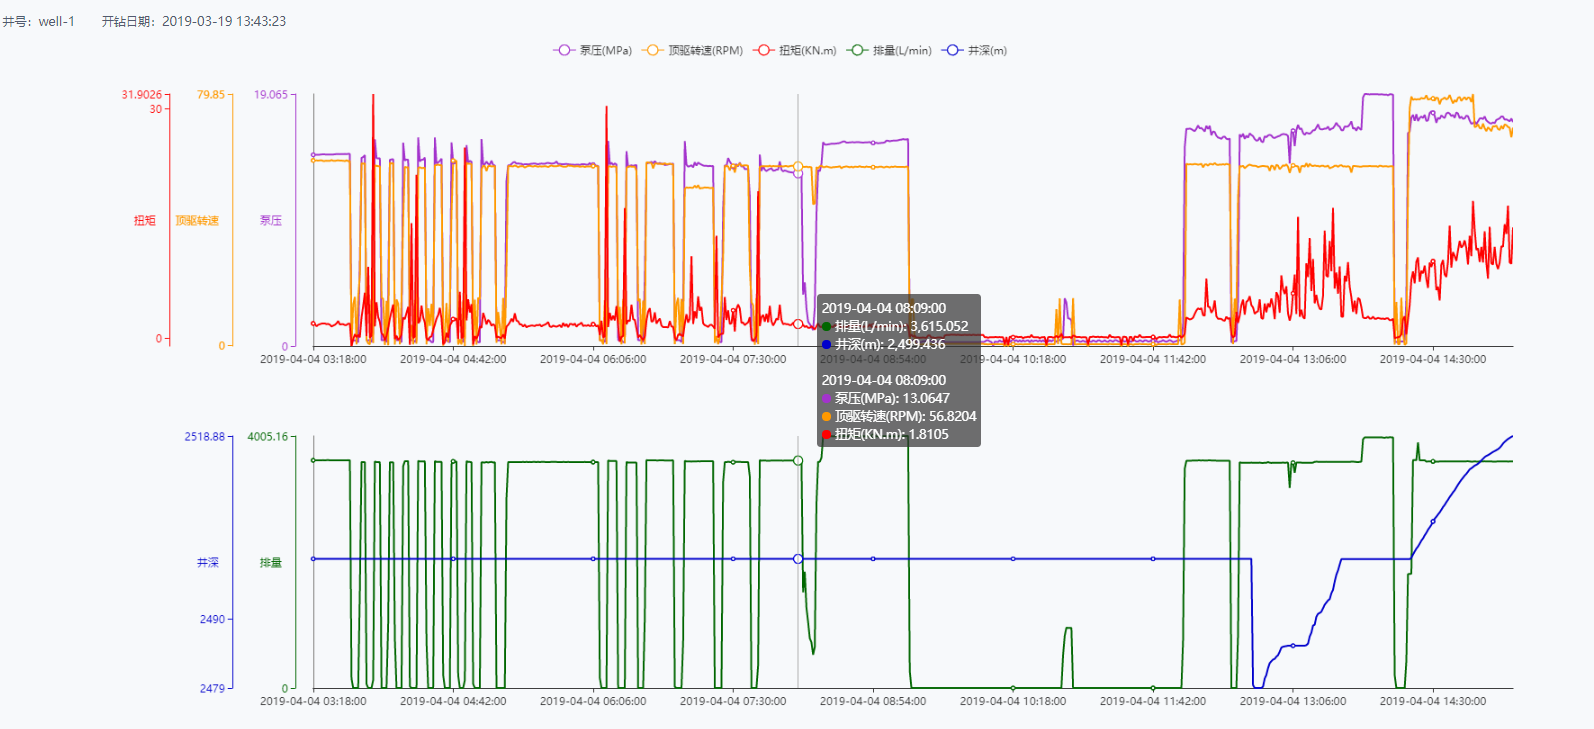
相信以上效果对于常用的小伙伴来说并不困难,

在此我只说option的配置,关于数据,就不在此赘述了,毕竟大家的情况都不太相同,处理就起来也不太一样。

option : {
                    grid: [{
                        left: '20%',
                        right: 50,
                        height: '35%'
                    }, {
                        left: '20%',
                        right: 50,
                        top: '55%',
                        height: '35%'
                    }],
                    tooltip: {
                        trigger: 'axis',
                        axisPointer: {
                            animation: false
                        }
                    },
                    dataZoom: [{
                        type: 'inside',
                        xAxisIndex: 0,
                        startValue: `${moment().subtract(12, 'h').format()}/${moment().format()}`,
                        filterMode: 'weakFilter',
                        borderColor: 'transparent',
                        backgroundColor: '#e2e2e2',
                        handleSize: 500
                    },{
                        type: 'inside',
                        xAxisIndex: 1,
                        startValue: `${moment().subtract(12, 'h').format()}/${moment().format()}`,
                        filterMode: 'weakFilter',
                        borderColor: 'transparent',
                        backgroundColor: '#e2e2e2',
                        handleSize: 500
                    }],
                    axisPointer: {
                        link: {
                            // 表示所有 xAxisIndex 为 0、3、4 和 yAxisName 为 'someName' 的坐标轴联动。
                            xAxisIndex: [0, 1],
                        }
                    },
                    legend: {
                        data: ['泵压(MPa)','顶驱转速(RPM)', '扭矩(KN.m)', '排量(L/min)', '井深(m)']
                    },
                    xAxis: [
                        {
                            type : 'category',
                            gridIndex: 0,
                            boundaryGap : false,
                            data: this.date,
                            axisTick: {
                                show: true,
                                alignWithLabel: true,
                                interval: 'auto'
                                },
                                axisLabel: {
                                interval: 'auto',
                            },
                        },
                        {
                            gridIndex: 1,
                            type : 'category',
                            boundaryGap : false,
                            data: this.date,
                            position: 'bottom',
                            axisTick: {
                                show: true,
                                alignWithLabel: true,
                                interval: 'auto'
                                },
                                axisLabel: {
                                interval: 'auto',
                            },
                        }
                    ],
                    yAxis: [
                        {
                            type: 'value',
                            name: '',
                            position: 'left',
                            gridIndex: 0,
                            axisLine: {
                                lineStyle: {
                                    color: '#797874'
                                }
                            },
                            splitLine: {
                                show: false
                            }
                        },
                        {
                            type: 'value',
                            name: '泵压',
                            position: 'left',
                            gridIndex: 0,
                            nameLocation: 'center',
                            nameRotate: 0,
                            min: function(value) {
                                return value.min.toFixed(4);
                            },
                            max: function(value) {
                                return value.max.toFixed(4);
                            },
                            offset: 20,
                            axisLine: {
                                lineStyle: {
                                    color: '#a333cc'
                                }
                            },
                            axisLabel: {
                                formatter: '{value}'
                            },
                            splitLine: {
                                show: false
                            },
                            splitNumber: 1
                        },
                        {
                            type: 'value',
                            name: '顶驱转速',
                            nameLocation: 'center',
                            nameRotate: 0,
                            gridIndex: 0,
                            min: function(value) {
                                return value.min.toFixed(2);
                            },
                            max: function(value) {
                                return value.max.toFixed(2);
                            },
                            position: 'left',
                            offset: 90,
                            axisLine: {
                                lineStyle: {
                                    color: '#ff9900'
                                }
                            },
                            axisLabel: {
                                formatter: '{value}'
                            },
                            splitLine: {
                                show: false // 是否显示坐标得横纵线
                            },
                            splitNumber: 1
                        }, {
                            type: 'value',
                            name: '扭矩',
                            gridIndex: 0,
                            min: function(value) {
                                return value.min.toFixed(4);
                            },
                            max: function(value) {
                                return value.max.toFixed(4);
                            },
                            offset: 160,
                            position: 'left',
                            nameLocation: 'center',
                            nameRotate: 0,
                            axisLine: {
                                lineStyle: {
                                    color: '#ff0000'
                                }
                            },
                            axisLabel: {
                                formatter: '{value}'
                            },
                            splitLine: {
                                show: false // 是否显示坐标得横纵线
                            },
                            splitNumber: 1
                        },
                        {
                            type: 'value',
                            name: '',
                            position: 'left',
                            gridIndex: 1,
                            axisLine: {
                                lineStyle: {
                                    color: '#797874'
                                }
                            },
                            splitLine: {
                                show: false
                            }
                        },
                        {
                            type: 'value',
                            name: '排量',
                            gridIndex: 1,
                            nameLocation: 'center',
                            nameRotate: 0,
                            min: function(value) {
                                return value.min.toFixed(2);
                            },
                            max: function(value) {
                                return value.max.toFixed(2);
                            },
                            offset: 20,
                            position: 'left',
                            axisLine: {
                                lineStyle: {
                                    color: '#006600'
                                }
                            },
                            axisLabel: {
                                formatter: '{value}'
                            },
                            splitLine: {
                                show: false // 是否显示坐标得横纵线
                            },
                            splitNumber: 1
                        },
                        ,{
                            type: 'value',
                            name: '井深',
                            gridIndex: 1,
                            min: function(value) {
                                return value.min.toFixed(2);
                            },
                            max: function(value) {
                                return value.max.toFixed(2);
                            },
                            position: 'left',
                            nameLocation: 'center',
                            nameRotate: 0,
                            offset: 90,
                            axisLine: {
                                lineStyle: {
                                    color: '#0000cc'
                                }
                            },
                            axisLabel: {
                                formatter: '{value}'
                            },
                            splitLine: {
                                show: false
                            },
                            splitNumber: 1
                        }
                    ],
                    series: [
                        {
                            name: '泵压(MPa)',
                            type: 'line',
                            yAxisIndex: 1,
                            xAxisIndex: 0,
                            color: '#a333cc',
                            data: []
                        },
                        {
                            name: '顶驱转速(RPM)',
                            type: 'line',
                            color: '#ff9900',
                            yAxisIndex: 2,
                            xAxisIndex: 0,
                            data: []
                        }, {
                            name: '扭矩(KN.m)',
                            type: 'line',
                            color: '#ff0000',
                            yAxisIndex: 3,
                            xAxisIndex: 0,
                            data: []
                        },
                        {
                            name: '排量(L/min)',
                            type: 'line',
                            yAxisIndex: 5,
                            xAxisIndex: 1,
                            color: '#006600',
                            data: []
                        },
                        {
                            name: '井深(m)',
                            type: 'line',
                            yAxisIndex: 6,
                            xAxisIndex: 1,
                            color: '#0000cc',
                            data: []
                        }
                    ]
                }

  我想说的是关于series的设置,一定要把,横坐标或者是纵坐标对应好,不然的话就很容易出现如下问题

        'type is undefined' 我的是报这个错喽,具体你的是什么错,我就不知道了,但是如果你的数据没有问题,图表不出来的话,就是 gridIndex ,yAxisIndex, xAxisIndex 没有对应好 

原文地址:https://www.cnblogs.com/fengxin666/p/10655133.html