Hystrix Dashboard (断路器:Hystrix 仪表盘)只监控一个实例,而Turbine监控多个实例,要使用Turbine必须使用Hystrix,因为Turbine是为了监控断路器的状态产生的。turbine.stream来聚合hystrix.stream端点。
1、Dashboard的实质是将微服务访问的API来显示出来,所以只有访问了服务接口,Dashboard上面才会出现数据,否则是不出现的。
ribbon和feign中如何使用dashboard:
参考如下连接:http://blog.csdn.net/seapeak007/article/details/77261729
2、在使用feign整合dashboard的时候,注意:Feign整合了Hystrix,但是我们还是需要添加Hystrix的依赖。
另外,在使用监控的时候,网络要好!否则根本不行!
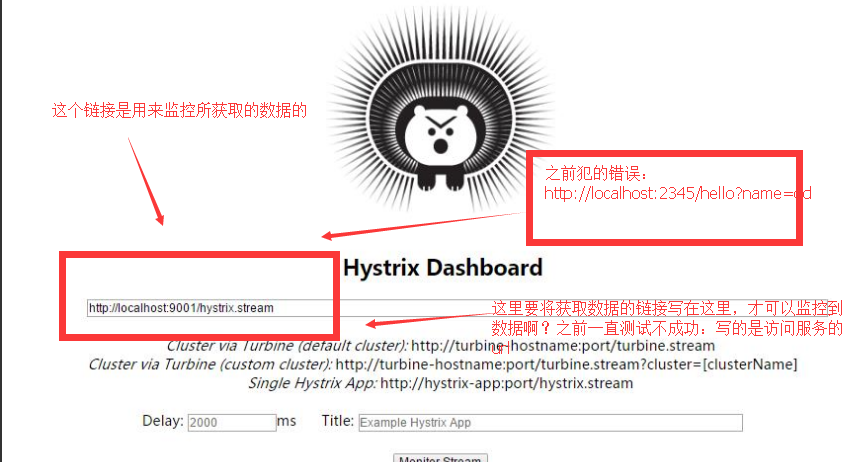
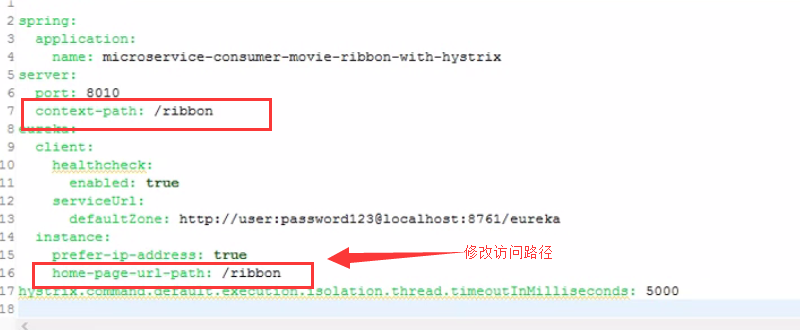
这里重点看下访问dashboard界面的url:
博客:
https://www.cnblogs.com/wangjing666/p/7049985.html
(1)查看数据:
http://localhost:2345/hystrix.stream
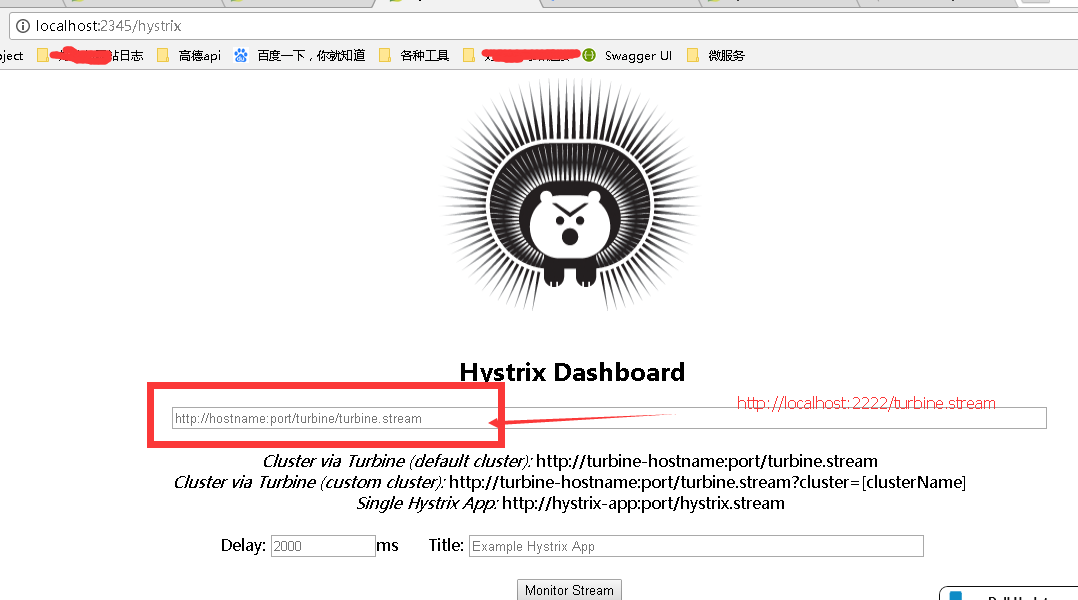
(2)查看dashboard:
http://localhost:2345/hystrix
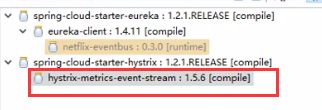
默认是上面红框的依赖,我们需要添加springcloud的Hystrix的依赖。

另外需要在启动类上面添加启动Hystrix的注解。
3、需要启动Hystix需要添加监控依赖:
<dependency>
<groupId>org.springframework.boot</groupId>
<artifactId>spring-boot-starter-actuator</artifactId>
</dependency>
4、Turbine(特本)的出现的原因:
生产环境中服务往往是集群部署的,我们需要监控多个服务,Turbine可以做一些监控数据的聚合,监控多个服务。
作用:汇总系统内多个服务的数据并显示到 Hystrix Dashboard 上。
Turbine的使用:

写一个Turbine的服务类,注册到Eureka上去,
在此服务中加入依赖,加入注解,配置需要监控的实例。

老版本的坑:

5、几个概念
hystrix.stream出现:
在引入spring-boot-starter-actuator依赖后,Spring Boot应用会暴露出/hystrix.stream端点以供监控工具读取该应用的Hystrix Metrics数据。
有个actuator的文章:http://blog.csdn.net/neosmith/article/details/70800663

这里监控有数据之后,我们就可以在dashboard上面看到波动。
spring-boot-starter-actuator的作用:在生产环境中,需要实时或定期监控服务的可用性。spring-boot 的actuator(监控)功能提供了很多监控所需的接口。所以说actuator即只要有监控就要使用这个依赖。http://blog.csdn.net/clementad/article/details/52045495
Turbine的使用:
创建一个单独的服务,然后添加依赖:添加注解,turbine需要注册到Eureka上面去,因为它要监控多个服务端点。
依赖:
<?xml version="1.0" encoding="UTF-8"?>
<project xmlns="http://maven.apache.org/POM/4.0.0" xmlns:xsi="http://www.w3.org/2001/XMLSchema-instance"
		 xsi:schemaLocation="http://maven.apache.org/POM/4.0.0 http://maven.apache.org/xsd/maven-4.0.0.xsd">
	<modelVersion>4.0.0</modelVersion>

	<groupId>com.springcloud.learning</groupId>
	<artifactId>hystrix-turbine</artifactId>
	<version>0.0.1-SNAPSHOT</version>
	<packaging>jar</packaging>

	<name>hystrix-turbine</name>
	<description>Demo project for Spring Boot</description>

	<parent>
		<groupId>org.springframework.boot</groupId>
		<artifactId>spring-boot-starter-parent</artifactId>
		<version>1.5.10.RELEASE</version>
		<relativePath/> <!-- lookup parent from repository -->
	</parent>

	<properties>
		<project.build.sourceEncoding>UTF-8</project.build.sourceEncoding>
		<project.reporting.outputEncoding>UTF-8</project.reporting.outputEncoding>
		<java.version>1.8</java.version>
		<spring-cloud.version>Edgware.SR1</spring-cloud.version>
	</properties>

	<dependencies>
		<dependency>
			<groupId>org.springframework.cloud</groupId>
			<artifactId>spring-cloud-starter-eureka</artifactId>
		</dependency>

		<dependency>
			<groupId>org.springframework.boot</groupId>
			<artifactId>spring-boot-starter-web</artifactId>
		</dependency>
		<dependency>
			<groupId>org.springframework.boot</groupId>
			<artifactId>spring-boot-starter-actuator</artifactId>
		</dependency>
		<dependency>
			<groupId>org.springframework.cloud</groupId>
			<artifactId>spring-cloud-starter-hystrix</artifactId>
		</dependency>

		<dependency>
			<groupId>org.springframework.cloud</groupId>
			<artifactId>spring-cloud-starter-hystrix-dashboard</artifactId>
		</dependency>
		<dependency>
			<groupId>org.springframework.cloud</groupId>
			<artifactId>spring-cloud-starter-turbine</artifactId>
		</dependency>
		<dependency>
			<groupId>org.springframework.boot</groupId>
			<artifactId>spring-boot-starter-test</artifactId>
			<scope>test</scope>
		</dependency>
	</dependencies>

	<dependencyManagement>
		<dependencies>
			<dependency>
				<groupId>org.springframework.cloud</groupId>
				<artifactId>spring-cloud-dependencies</artifactId>
				<version>${spring-cloud.version}</version>
				<type>pom</type>
				<scope>import</scope>
			</dependency>
		</dependencies>
	</dependencyManagement>

	<build>
		<plugins>
			<plugin>
				<groupId>org.springframework.boot</groupId>
				<artifactId>spring-boot-maven-plugin</artifactId>
			</plugin>
		</plugins>
	</build>


</project>
注解:

如何监控服务呢?
1、首先查看是否有数据:查看turbine端口是否有数据?
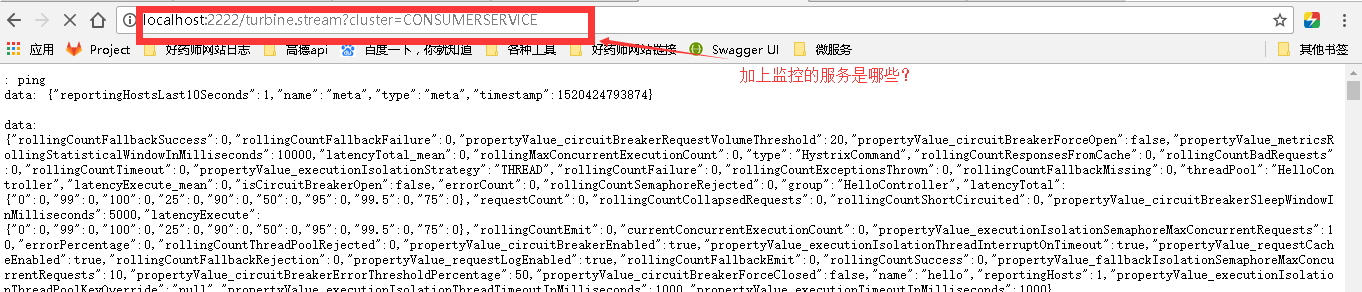
根据上面在配置文件中的配置添加配置即可,配置监控服务的名称

2、在所监控的服务路径上面查看hystrix的dashboard上面查看服务状况

结果:

如何监控多个服务呢?
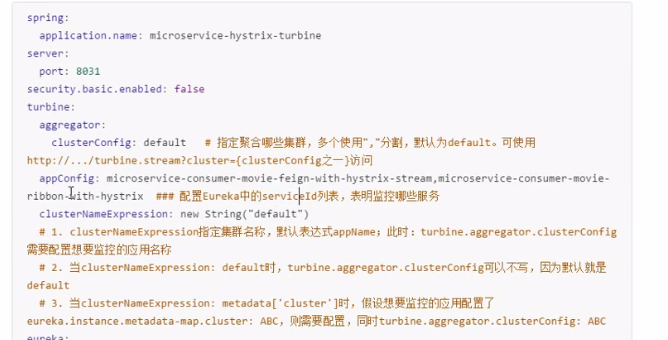
配置文件:

测试:这个时候监控数据的链接已经改变:
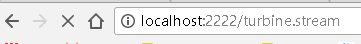
注意这里不加后面的服务名称了,因为上面配置默认了,是由多个服务列表。
查看界面图:
结果:
