2 pandas中的绘图函数
matplotlib作图比较麻烦,在pandas中就比较容易了。
2.1 线性图
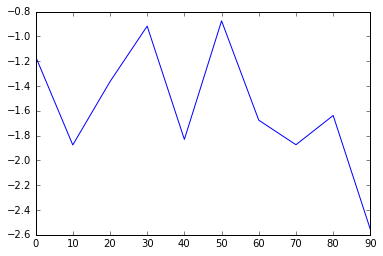
s = Series(np.random.randn(10).cumsum(), index=np.arange(0,100,10))
s.plot()
结果:
df = DataFrame(np.random.randn(10,4).cumsum(0),columns=list('ABCD'), index=np.arange(0,100,10))
df.plot()
结果:

图表示例:


2.2 柱状图
指定kind为bar和barh。
import numpy as np
import pandas as pd
from pandas import Series,DataFrame
import matplotlib.pyplot as plt
# 两个子图
fig,axes = plt.subplots(2,1)

data = Series(np.random.rand(16), index=list('abcdefghiljkmnop'))
# kind:表示类型,bar和barh
data.plot(kind='bar', ax=axes[0], color='k', alpha=0.7)  # 纵向
data.plot(kind='barh', ax=axes[1], color='k', alpha=0.7)  # 横向
结果:

df = DataFrame(np.random.rand(6,4),
               index=['one','two','three','four','five','six'],
                columns = pd.Index(['A','B','C','D'], name='Genus')
               )

df.plot(kind='bar',stacked=True,alpha=0.75)
# stacked True 表示堆积,False表示不堆积
# alpha 表示透明度
结果:

2.3 直方图和密度图
# 直方图:hist
df.sum(axis=1).hist(bins=15)
# 等价于
df.sum(axis=1).plot(kind='hist')

## 密度图:kde--标准混合正态分布
df.sum(axis=1).plot(kind='kde')
df = DataFrame(np.random.rand(26,4),
               index=list('abcdefghijklmnopqrstuvwxyz'),
                columns = pd.Index(['A','B','C','D'], name='Genus')
               )
df.sum(axis=0).plot(kind='hist')  # 直方图
df.sum(axis=0).plot(kind='kde')   # 密度
结果:

2.4 散布图
scatter方法用于绘制散布图
# 100个0-1的随机点,传入x,y两个参数
plt.scatter(np.random.rand(100),np.random.rand(100))
plt.title('100 Random number')

3 python图形化工具生态系统
略。
基于web的图形化工具才是图形化工具的未来。