1.这里看到的是 主机cpu 90% 都给消耗掉了,主要是mysql 进程消耗资源
top - 14:46:26 up 266 days, 20:41, 4 users, load average: 17.14, 15.68, 10.69
Tasks: 264 total, 1 running, 263 sleeping, 0 stopped, 0 zombie
Cpu(s): 69.5%us, 21.2%sy, 0.0%ni, 9.4%id, 0.0%wa, 0.0%hi, 0.0%si, 0.0%st
Mem: 16333448k total, 9920660k used, 6412788k free, 488896k buffers
Swap: 2097148k total, 24448k used, 2072700k free, 3965104k cached
PID USER PR NI VIRT RES SHR S %CPU %MEM TIME+ COMMAND
9386 mysql 20 0 14.6g 4.5g 9164 S 723.8 28.9 416:42.07 /db/mysql/app/mysql/bin/mysqld --defaults-file=/db/mysql/app/mysql/my.cnf --basedi
11846 root 20 0 15168 1380 940 R 0
2。使用mysql 巡检脚本,检查当前的processlist 列表 ,
主要等待事件是 Sending data 和 Waiting for table metadata lock 2个类型的等待事件。
Id User Host db Command Time State Info
473 resync 56.16.3.21:56636 NULL Binlog Dump GTID 52765 Master has sent all binlog to slave; waiting for binlog to be updated NULL
47414 db 10.200.210.61:36735 user Sleep 142 NULL
79608 db 56.16.3.26:38200 cbrc Query 2694 Sending data select c.*, i.*, (select max(dc.data_collect_mil) from data_collect_detl
79748 db 10.200.210.66:33393 cbrc Query 2563 Sending data select c.*, i.*, (select max(dc.data_collect_mil) from data_collect_detl
79928 db 10.200.210.66:33529 cbrc Query 2457 Sending data select c.*, i.*, (select max(dc.data_collect_mil) from data_collect_detl
80492 db 56.16.3.26:38395 cbrc Query 2211 Sending data select c.*, i.*, (select max(dc.data_collect_mil) from data_collect_detl
80562 db 56.16.3.26:38410 cbrc Query 2182 Sending data select c.*, i.*, (select max(dc.data_collect_mil) from data_collect_detl
80645 db 56.16.3.26:38425 cbrc Query 2151 Sending data select c.*, i.*, (select max(dc.data_collect_mil) from data_collect_detl
80658 db 56.16.3.26:38434 cbrc Query 2130 Sending data select c.*, i.*, (select max(dc.data_collect_mil) from data_collect_detl
80716 db 56.16.3.26:38449 cbrc Query 2095 Sending data select c.*, i.*, (select max(dc.data_collect_mil) from data_collect_detl
80996 db 56.16.3.26:38496 cbrc Query 2070 Sending data select c.*, i.*, (select max(dc.data_collect_mil) from data_collect_detl
81043 db 56.16.3.26:38501 cbrc Query 1895 Sending data select c.*, i.*, (select max(dc.data_collect_mil) from data_collect_detl
81530 db 56.16.3.26:38621 cbrc Query 1508 Sending data select c.*, i.*, (select max(dc.data_collect_mil) from data_collect_detl
81736 db 56.16.3.26:38685 cbrc Query 1463 Sending data select c.*, i.*, (select max(dc.data_collect_mil) from data_collect_detl
82182 db 56.16.3.26:38757 cbrc Query 1448 Sending data select c.*, i.*, (select max(dc.data_collect_mil) from data_collect_detl
82783 db 56.16.3.26:38901 cbrc Query 1156 Sending data select c.*, i.*, (select max(dc.data_collect_mil) from data_collect_detl
82788 db 56.16.3.26:38902 cbrc Query 1116 Sending data select c.*, i.*, (select max(dc.data_collect_mil) from data_collect_detl
82789 db 56.16.3.26:38903 cbrc Query 1088 Sending data select c.*, i.*, (select max(dc.data_collect_mil) from data_collect_detl
82790 db 56.16.3.26:38904 cbrc Query 943 Sending data select c.*, i.*, (select max(dc.data_collect_mil) from data_collect_detl
83054 db 10.200.210.66:36161 cbrc Query 996 Sending data select c.*, i.*, (select max(dc.data_collect_mil) from data_collect_detl
83058 db 10.200.210.66:36162 cbrc Query 981 Sending data select c.*, i.*, (select max(dc.data_collect_mil) from data_collect_detl
83059 db 10.200.210.66:36163 cbrc Query 883 Sending data select c.*, i.*, (select max(dc.data_collect_mil) from data_collect_detl
83060 db 10.200.210.66:36164 cbrc Query 830 Sending data select c.*, i.*, (select max(dc.data_collect_mil) from data_collect_detl
83404 db 56.16.3.26:39045 cbrc Query 391 Waiting for table metadata lock select c.*, i.*, (select max(dc.data_collect_mil) from data_collect_detl
83552 db 10.200.210.66:36670 cbrc Query 271 Waiting for table metadata lock insert into data_collect_detl (detl_id, data_indc_id, data_collect_id, data_result, data_coll
3.对于2类等待事件。
3.1.1 Sending data -》 说明这个SQL 正在运行,消耗CPU ,有可能需要 优化SQL,现在可以考虑临时kill 掉所有运行这个SQL的session.
如果没有kill 这些select 的session,单独对表truncate 也会造成等待,
因为mysql 的tuncate 会等待所有慢长查询完成,才能进行, 另外 慢长的查询,执行delete 语句,不会等待慢长查询完成、
通过检查慢查询,发现如下SQL 比较消耗资源,后期考虑优化。
select c.*, i.*, (select max(dc.data_collect_mil) from data_collect_detl dc where dc.data_indc_id =i.data_indc_id and dc.rmk='success') as data_collect_mil, (select dc2.data_result from data_collect_detl dc2 where dc2.data_indc_id=i.data_indc_id and dc2.data_collect_mil=( select max(data_collect_mil) from data_collect_detl d where d.rmk='success' and d.data_indc_id=i.data_indc_id)) as data_result from data_collect_conf c left join data_indc_conf i on c.data_collect_id = i.data_collect_id order by i.data_collect_id,i.data_indc_order
--kill session 的方法,
select concat('KILL ',id,';') from information_schema.processlist where db='cbrc' into outfile '/tmp/a.txt'
3.2 Waiting for table metadata lock -》 说明有SQL 正在对表 做DDL 操作,因此引起了阻塞.
经过检查对 用户正在对该表 data_collect_detl 做add index 操作,kill 掉 add index 这个session ,这个等待就消失了。
| 84119 | db | 10.200.210.237:51793 | cbrc | Query | 2704 | Waiting for table metadata lock | alter table `cbrc`.`data_collect_detl` add index `index_data_indc_id` (`data_indc_id`)
处理方法
KILL 84119;
###感谢 DBA学习记录 111
mysql 批量kill session
DBA学习记录 2018-01-14 10:53:46 1368 收藏
展开
root@localhost > select concat('KILL ',id,';') from information_schema.processlist where user=’sam' into outfile '/tmp/a.txt
脚本内容如下:
+------------------------+
| concat('KILL ',id,';') |
+------------------------+
| KILL 31964612; |
| KILL 31964609; |
| KILL 31964611; |
…...
| KILL 31966619; |
| KILL 31966620; |
+------------------------+
991 rows in set (0.02 sec)
root@localhost >
4.执行上面生成的KILL脚本
root@localhost > source /tmp/a.txt
Query OK, 0 rows affected (0.00 sec)
Query OK, 0 rows affected (0.00 sec)
……
https://blog.csdn.net/hellosunqi/article/details/79055383
##################
######## 222
The Slow Query Log
直接查看mysql-slow.log
# Query_time: 2.302229 Lock_time: 0.000346 Rows_sent: 1 Rows_examined: 1916238
SET timestamp=1588843823;
select count(1) as total from (select * from (select a.*,CONCAT(@rowno:=@rowno+1,'') as rownum_ from (
如果启用了慢查询日志并将FILE其选择为输出目标,则写入日志的每个语句都以一行开头,该行以#字符开头 并具有以下字段(所有字段都位于一行):
Query_time: duration
语句执行时间,以秒为单位。
Lock_time: duration
获取锁的时间(以秒为单位)。
Rows_sent: N
发送给客户端的行数。
Rows_examined:
服务器层检查的行数(不计算存储引擎内部的任何处理)。
写入慢查询日志文件的每个语句之前都有一个SET 包含时间戳的语句。从MySQL 8.0.14开始,时间戳指示慢速语句何时开始执行。在8.0.14之前,时间戳指示慢速语句的记录时间(在该语句完成执行之后发生)。
##感谢https://www.percona.com/doc/percona-toolkit/LATEST/pt-query-digest.html
##感谢 https://dev.mysql.com/doc/refman/8.0/en/slow-query-log.html
pt-query-digest inspects the columns in the table. The table must have at least the following columns:
CREATE TABLE query_review_history (
checksum CHAR(32) NOT NULL,
sample TEXT NOT NULL
);
Any columns not mentioned above are inspected to see if they follow a certain naming convention. The column is special if the name ends with an underscore followed by any of these values:
pct|avg|cnt|sum|min|max|pct_95|stddev|median|rank
If the column ends with one of those values, then the prefix is interpreted as the event attribute to store in that column, and the suffix is interpreted as the metric to be stored. For example, a column named Query_time_min will be used to store the minimum Query_time for the class of events.
Next is the table of metrics about this class of queries.
# pct total min max avg 95% stddev median
# Count 0 2
# Exec time 13 1105s 552s 554s 553s 554s 2s 553s
# Lock time 0 216us 99us 117us 108us 117us 12us 108us
# Rows sent 20 6.26M 3.13M 3.13M 3.13M 3.13M 12.73 3.13M
# Rows exam 0 6.26M 3.13M 3.13M 3.13M 3.13M 12.73 3.13M
The first line is column headers for the table. The percentage is the percent of the total for the whole analysis run, and the total is the actual value of the specified metric. For example, in this case we can see that the query executed 2 times, which is 13% of the total number of queries in the file. The min, max and avg columns are self-explanatory. The 95% column shows the 95th percentile; 95% of the values are less than or equal to this value. The standard deviation shows you how tightly grouped the values are. The standard deviation and median are both calculated from the 95th percentile, discarding the extremely large values.
The stddev, median and 95th percentile statistics are approximate. Exact statistics require keeping every value seen, sorting, and doing some calculations on them. This uses a lot of memory. To avoid this, we keep 1000 buckets, each of them 5% bigger than the one before, ranging from .000001 up to a very big number. When we see a value we increment the bucket into which it falls. Thus we have fixed memory per class of queries. The drawback is the imprecision, which typically falls in the 5 percent range.
最后,如果要在日志文件中查找查询示例,则可以在其中查找字节偏移量。(由于慢日志格式中的某些异常,这并不总是准确的,但通常是正确的。)该位置是指最差的样本,我们将在下文中详细介绍。
接下来是有关此类查询的指标表。
#pct 总计最小最大平均95%stddev中位数#计数0 2
#执行时间13 1105s 552s 554s 553s 554s 2s 553s
#锁定时间0 216us 99us 117us 108us 117us 12us 108us
#发送的行20 6.26M
3.13M 3.13M 3.13M 3.13M 3.13M 12.73 3.13M#行考试0 6.26M 3.13M 3.13M 3.13M 3.13M 12.73 3.13M
第一行是表的列标题。百分比是整个分析运行中总计的百分比,总计是指定指标的实际值。例如,在这种情况下,我们可以看到查询执行了2次,占文件查询总数的13%。最小值,最大值和平均值列是不言自明的。95%列显示第95个百分点;95%的值小于或等于此值。标准偏差显示值的紧密程度。标准偏差和中位数都是从第95个百分位数计算得出的,丢弃了非常大的值。
stddev,中位数和第95个百分位数的统计数据均为近似值。确切的统计信息要求保留每个可见的值,对其进行排序并进行一些计算。这会占用大量内存。为避免这种情况,我们保留了1000个存储桶,每个存储桶都比以前的存储桶大5%,范围从.000001到很大的数字。当我们看到一个值时,便增加它所属的存储桶。因此,每类查询都有固定的内存。缺点是不精确度,通常不超过5%。
##sample
6AE2E64878779CE70A1744847528E482 select distinct t.result_id,t.*,? a inspection db 2020-05-07 14:01:56 52 208.032 2.02074 7.04318 0.006151 0.000091 0.000176
query_time_sum=208.032 seconds
query_count=52
query_avg=4
query_time_min=2.02074 seconds
query_time_max =7.04318 seconds
##########
###
感谢percona y Juan Arruti
https://www.percona.com/blog/2020/04/23/a-simple-approach-to-troubleshooting-high-cpu-in-mysql/
One of our customers recently asked whether it is possible to identify, from the MySQL side, the query that is causing high CPU usage on his system. The usage of simple OS tools to find the culprit has been a widely used technique for a long time by PostgreSQL and Oracle DBAs, but it didn’t work for MySQL as historically we’ve lacked the instrumentation to match an OS thread with an internal processlist thread – until recently.
Percona added support to map processlist ids to OS thread ids through column TID of the information_schema.processlist table starting on Percona Server for MySQL 5.6.27. With the release of 5.7, MySQL followed with its own implementation by extending the PERFORMANCE_SCHEMA.THREADS table and adding a new column named THREAD_OS_ID, which Percona Server for MySQL adopted in place of its own, as it usually does remain as close to upstream as possible.
The following approach is useful for cases where there is a query overloading one particular CPU while other cores are performing normally. For cases where it is a general CPU usage issue, different methods can be used, such as the one in this other blog post Reducing High CPU on MySQL: A Case Study.
How can we use this new column to find out which session is using the most CPU resources in my database?
Let’s use an example:
To troubleshoot CPU issues, we can use several tools, such as top or pidstat (requires the sysstat package). In the following example, we will use pidstat. The tool has an option (-t) that changes its view from process (the default) to threads, where it shows the associated threads within a given process. We can use it to find out which thread is consuming the most CPU in our server. Adding the -p parameter along with the mysql process id so the tool only shows MySQL threads, making it easier for us to troubleshoot. The last parameter (1) is to display one sample per second:
The command is pidstat -t -p <mysqld_pid> 1:
|
1
2
3
4
5
6
7
8
9
10
11
12
13
14
15
16
17
18
19
20
21
22
|
shell> pidstat -t -p 31258 1
03:31:06 PM UID TGID TID %usr %system %guest %CPU CPU Command
[...]
03:31:07 PM 10014 - 32039 5.00 1.00 0.00 6.00 22 |__mysqld
03:31:07 PM 10014 - 32040 5.00 1.00 0.00 6.00 23 |__mysqld
03:31:07 PM 10014 - 32042 6.00 1.00 0.00 7.00 8 |__mysqld
03:31:07 PM 10014 - 32047 5.00 1.00 0.00 6.00 6 |__mysqld
03:31:07 PM 10014 - 32048 5.00 1.00 0.00 6.00 15 |__mysqld
03:31:07 PM 10014 - 32049 5.00 1.00 0.00 6.00 14 |__mysqld
03:31:07 PM 10014 - 32052 5.00 1.00 0.00 6.00 14 |__mysqld
03:31:07 PM 10014 - 32053 94.00 0.00 0.00 94.00 9 |__mysqld
03:31:07 PM 10014 - 32055 4.00 1.00 0.00 5.00 10 |__mysqld
03:31:07 PM 10014 - 4275 5.00 1.00 0.00 6.00 10 |__mysqld
03:31:07 PM 10014 - 4276 5.00 1.00 0.00 6.00 7 |__mysqld
03:31:07 PM 10014 - 4277 6.00 1.00 0.00 7.00 15 |__mysqld
03:31:07 PM 10014 - 4278 5.00 1.00 0.00 6.00 18 |__mysqld
03:31:07 PM 10014 - 4279 5.00 1.00 0.00 6.00 10 |__mysqld
03:31:07 PM 10014 - 4280 5.00 1.00 0.00 6.00 12 |__mysqld
03:31:07 PM 10014 - 4281 5.00 1.00 0.00 6.00 11 |__mysqld
03:31:07 PM 10014 - 4282 4.00 1.00 0.00 5.00 2 |__mysqld
03:31:07 PM 10014 - 35261 0.00 0.00 0.00 0.00 4 |__mysqld
03:31:07 PM 10014 - 36153 0.00 0.00 0.00 0.00 5 |__mysqld
|
We can see that the thread 32053 is consuming the most CPU by quite a large margin, and we made sure to verify that the consumption is constant across multiple samples of pidstat. Using that information, we can log into the database and use the following query to find out which MySQL Thread is the culprit:
|
1
2
3
4
5
6
7
8
9
10
11
12
13
14
15
16
17
18
19
20
|
mysql > select * from performance_schema.threads where THREAD_OS_ID = 32053 G
*************************** 1. row ***************************
THREAD_ID: 686
NAME: thread/sql/one_connection
TYPE: FOREGROUND
PROCESSLIST_ID: 590
PROCESSLIST_USER: msandbox
PROCESSLIST_HOST: localhost
PROCESSLIST_DB: NULL
PROCESSLIST_COMMAND: Query
PROCESSLIST_TIME: 0
PROCESSLIST_STATE: Sending data
PROCESSLIST_INFO: select * from test.joinit where b = 'a a eveniet ut.'
PARENT_THREAD_ID: NULL
ROLE: NULL
INSTRUMENTED: YES
HISTORY: YES
CONNECTION_TYPE: SSL/TLS
THREAD_OS_ID: 32053
1 row in set (0.00 sec)
|
There we go! Now we know that the high CPU consumption comes from a query in the joinit table, being executed by the user msandbox from localhost in the database test. Using this information we can troubleshoot the query and check the execution plan with the EXPLAIN command to see if there is any room for improvement.
|
1
2
3
4
5
6
7
8
9
10
11
12
13
14
15
|
mysql > explain select * from test.joinit where b = 'a a eveniet ut.' G
*************************** 1. row ***************************
id: 1
select_type: SIMPLE
table: joinit
partitions: NULL
type: ALL
possible_keys: NULL
key: NULL
key_len: NULL
ref: NULL
rows: 7170836
filtered: 10.00
Extra: Using where
1 row in set, 1 warning (0.00 sec)
|
In this case, it was a simple index that was missing!
|
1
2
3
|
mysql > alter table test.joinit add index (b) ;
Query OK, 0 rows affected (15.18 sec)
Records: 0 Duplicates: 0 Warnings: 0
|
After we create the index, we are no longer seeing CPU spikes:
|
1
2
3
4
5
6
7
8
9
10
11
12
13
14
15
16
17
18
19
20
21
22
|
shell> pidstat -t -p 31258 1
03:37:53 PM UID TGID TID %usr %system %guest %CPU CPU Command
[...]
03:37:54 PM 10014 - 32039 25.00 6.00 0.00 31.00 0 |__mysqld
03:37:54 PM 10014 - 32040 25.00 5.00 0.00 30.00 21 |__mysqld
03:37:54 PM 10014 - 32042 25.00 6.00 0.00 31.00 20 |__mysqld
03:37:54 PM 10014 - 32047 25.00 4.00 0.00 29.00 23 |__mysqld
03:37:54 PM 10014 - 32048 25.00 7.00 0.00 32.00 22 |__mysqld
03:37:54 PM 10014 - 32049 23.00 6.00 0.00 29.00 4 |__mysqld
03:37:54 PM 10014 - 32052 23.00 7.00 0.00 30.00 14 |__mysqld
03:37:54 PM 10014 - 32053 10.00 2.00 0.00 12.00 11 |__mysqld
03:37:54 PM 10014 - 32055 24.00 6.00 0.00 30.00 1 |__mysqld
03:37:54 PM 10014 - 4275 25.00 6.00 0.00 31.00 7 |__mysqld
03:37:54 PM 10014 - 4276 25.00 6.00 0.00 31.00 1 |__mysqld
03:37:54 PM 10014 - 4277 24.00 5.00 0.00 29.00 14 |__mysqld
03:37:54 PM 10014 - 4278 24.00 6.00 0.00 30.00 9 |__mysqld
03:37:54 PM 10014 - 4279 25.00 5.00 0.00 30.00 6 |__mysqld
03:37:54 PM 10014 - 4280 26.00 5.00 0.00 31.00 14 |__mysqld
03:37:54 PM 10014 - 4281 24.00 6.00 0.00 30.00 10 |__mysqld
03:37:54 PM 10014 - 4282 25.00 6.00 0.00 31.00 10 |__mysqld
03:37:54 PM 10014 - 35261 0.00 0.00 0.00 0.00 4 |__mysqld
03:37:54 PM 10014 - 36153 0.00 0.00 0.00 0.00 5 |__mysqld
|
Why not use this approach to troubleshoot IO and Memory issues?
The issue with measuring thread IO from the OS side is that most of the MySQL IO operations are done by background threads, such as read, write, and page cleaner threads. To measure thread IO you can use tools like pidstat with the -d (IO instead of CPU) option or iostat with -H (per thread). If you have a very IO-consuming thread you might be able to see it, but be warned that the results can be misleading because of the background thread operations.
Memory consumption is an even trickier resource to measure from the OS side, as all memory is allocated under the MySQL process, and since it is MySQL that manages its memory access, it is transparent for the OS which thread is consuming the most memory. For this, we can use the perfomance_schema memory instrumentation available starting in 5.7.
Conclusion
There are many approaches to troubleshooting high CPU usage, but here we present a simple, widely-used approach on Oracle and PostgreSQL databases that can be adapted to MySQL, starting from version 5.7. By tracking down from the OS thread consumption to the database side, we can quickly detect CPU intensive queries that are affecting the system performance.
Correctly understanding the true cause of database performance problems allows for a quick and efficient resolution – yet enterprises often lack this crucial information. Without it, your solution could require more time and resources than necessary, or inefficiently address the issue. And contrary to popular belief, the problem is not always the database itself!
####
感谢percona Marcelo Altmann Reducing High CPU on MySQL: a Case Study
https://www.percona.com/blog/2019/03/07/reducing-high-cpu-on-mysql-a-case-study/
n this blog post, I want to share a case we worked on a few days ago. I’ll show you how we approached the resolution of a MySQL performance issue and used Percona Monitoring and Management PMM to support troubleshooting. The customer had noticed a linear high CPU usage in one of their MySQL instances and was not able to figure out why as there was no much traffic hitting the app. We needed to reduce the high CPU usage on MySQL. The server is a small instance:
|
1
2
|
Models | 6xIntel(R) Xeon(R) CPU E5-2430 0 @ 2.20GHz
10GB RAM
|
This symptom can be caused by various different reasons. Let’s see how PMM can be used to troubleshoot the issue.
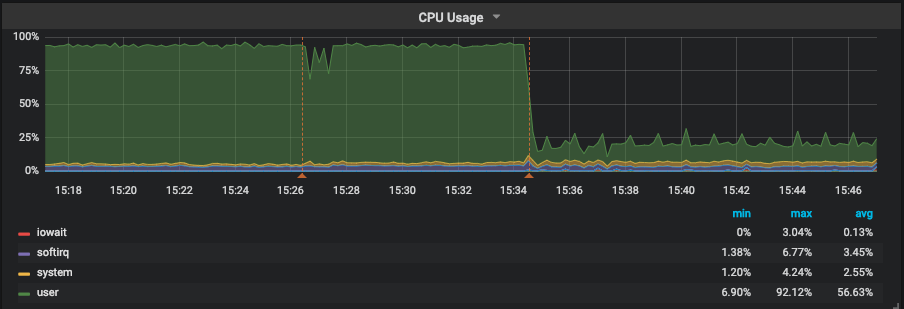
CPU

It’s important to understand where the CPU time is being consumed: user space, system space, iowait, and so on. Here we can see that CPU usage was hitting almost 100% and the majority of the time was being spent on user space. In other words, the time the CPU was executing user code, such as MySQL. Once we determined that the time was being spent on user space, we could discard other possible issues. For example, we could eliminate the possibility that a high amount of threads were competing for CPU resources, since that would cause an increase in context switches, which in turn would be taken care of by the kernel – system space.
With that we decided to look into MySQL metrics.
MySQL


As expected, there weren’t a lot of threads running—10 on average—and MySQL wasn’t being hammered with questions/transactions. It was running from 500 to 800 QPS (queries per second). Next step was to check the type of workload that was running on the instance:

In red we can see that almost all commands are SELECTS. With that in mind, we checked the handlers using SHOW STATUS LIKE 'Handler%' to verify if those selects were doing an index scan, a full table scan or what.

Blue in this graph represents Handler_read_rnd_next , which is the counter MySQL increments every time it reads a row when it’s doing a full table scan. Bingo!!! Around 350 selects were reading 2.5 million rows. But wait—why was this causing CPU issues rather than IO issues? If you refer to the first graph (CPU graph) we cannot see iowait.
That is because the data was stored in the InnoDB Buffer Pool, so instead of having to read those 2.5M rows per second from disk, it was fetching them from memory. The stress had moved from disk to CPU. Now that we identified that the issue had been caused by some queries or query, we went to QAN to verify the queries and check their status:

First query, a SELECT on table store.clients was responsible for 98% of the load and was executing in 20+ seconds.

EXPLAIN confirmed our suspicions. The query was accessing the table using type ALL, which is the last type we want as it means “Full Table Scan”. Taking a look into the fingerprint of the query, we identified that it was a simple query:


The query was filtering clients based on the status field SELECT * FROM store.clients WHERE status = ? As shown in the indexes, that column was not indexed. Talking with the customer, this turned out to be a query that was introduced as part of a new software release.
From that point, we were confident that we had identified the problem. There could be more, but this particular query was definitely hurting the performance of the server. We decided to add an index and also sent an annotation to PMM, so we could refer back to the graphs to check when the index has been added, check if CPU usage had dropped, and also check Handler_read_rnd_next.
To run the alter we decided to use pt-online-schema-change as it was a busy table, and the tool has safeguards to prevent the situation from becoming even worse. For example, we wanted to pause or even abort the alter in the case of the number of Threads_Running exceeding a certain threshold. The threshold is controlled by --max-load (25 by default) and --critical-load (50 by default):
|
1
2
3
4
5
6
7
8
9
10
11
12
13
14
15
16
17
18
19
20
21
22
23
24
25
26
27
28
29
30
31
32
33
34
35
36
37
38
39
40
41
42
43
44
45
|
pmm-admin annotate "Started ALTER store.clients ADD KEY (status)" &&
pt-online-schema-change --alter "ADD KEY (status)" --execute u=root,D=store,t=clients &&
pmm-admin annotate "Finished ALTER store.clients ADD KEY (status)"
Your annotation was successfully posted.
No slaves found. See --recursion-method if host localhost.localdomain has slaves.
Not checking slave lag because no slaves were found and --check-slave-lag was not specified.
Operation, tries, wait:
analyze_table, 10, 1
copy_rows, 10, 0.25
create_triggers, 10, 1
drop_triggers, 10, 1
swap_tables, 10, 1
update_foreign_keys, 10, 1
Altering `store`.`clients`...
Creating new table...
Created new table store._clients_new OK.
Altering new table...
Altered `store`.`_clients_new` OK.
2019-02-22T18:26:25 Creating triggers...
2019-02-22T18:27:14 Created triggers OK.
2019-02-22T18:27:14 Copying approximately 4924071 rows...
Copying `store`.`clients`: 7% 05:46 remain
Copying `store`.`clients`: 14% 05:47 remain
Copying `store`.`clients`: 22% 05:07 remain
Copying `store`.`clients`: 30% 04:29 remain
Copying `store`.`clients`: 38% 03:59 remain
Copying `store`.`clients`: 45% 03:33 remain
Copying `store`.`clients`: 52% 03:06 remain
Copying `store`.`clients`: 59% 02:44 remain
Copying `store`.`clients`: 66% 02:17 remain
Copying `store`.`clients`: 73% 01:50 remain
Copying `store`.`clients`: 79% 01:23 remain
Copying `store`.`clients`: 87% 00:53 remain
Copying `store`.`clients`: 94% 00:24 remain
2019-02-22T18:34:15 Copied rows OK.
2019-02-22T18:34:15 Analyzing new table...
2019-02-22T18:34:15 Swapping tables...
2019-02-22T18:34:27 Swapped original and new tables OK.
2019-02-22T18:34:27 Dropping old table...
2019-02-22T18:34:32 Dropped old table `store`.`_clients_old` OK.
2019-02-22T18:34:32 Dropping triggers...
2019-02-22T18:34:32 Dropped triggers OK.
Successfully altered `store`.`clients`.
Your annotation was successfully posted.
|
Results


As we can see, above, CPU usage dropped to less than 25%, which is 1/4 of the previous usage level. Handler_read_rnd_next dropped and we can’t even see it once pt-osc has finished. We had a small increase on Handler_read_next as expected because now MySQL is using the index to resolve the WHERE clause. One interesting outcome is that the instance was able to increase it’s QPS by 2x after the index was added as CPU/Full Table Scan was no longer limiting performance. On average, query time has dropped from 20s to only 661ms.
Summary:
- Applying the correct troubleshooting steps to your problems is crucial:
a) Understand what resources have been saturated.
b) Understand what if anything is causing an error.
c) From there you can divert into the areas that are related to that resource and start to narrow down the issue.
d) Tackle the problems bit by bit. - Having the right tools for the job key for success. PMM is a great example of a tool that can help you quickly identify, drill in, and fix bottlenecks.
- Have realistic load tests. In this case, they had tested the new release on a concurrency level that was not like their production
- By identifying the culprit query we were able to:
a.) Drop average query time from 20s to 661ms
b.) Increase QPS by 2x
c.) Reduce the usage of CPU to 1/4 of its level prior to our intervention
Disclosure: For security reasons, sensitive information, such as database, table, column names have been modified and graphs recreated to simulate a similar problem.