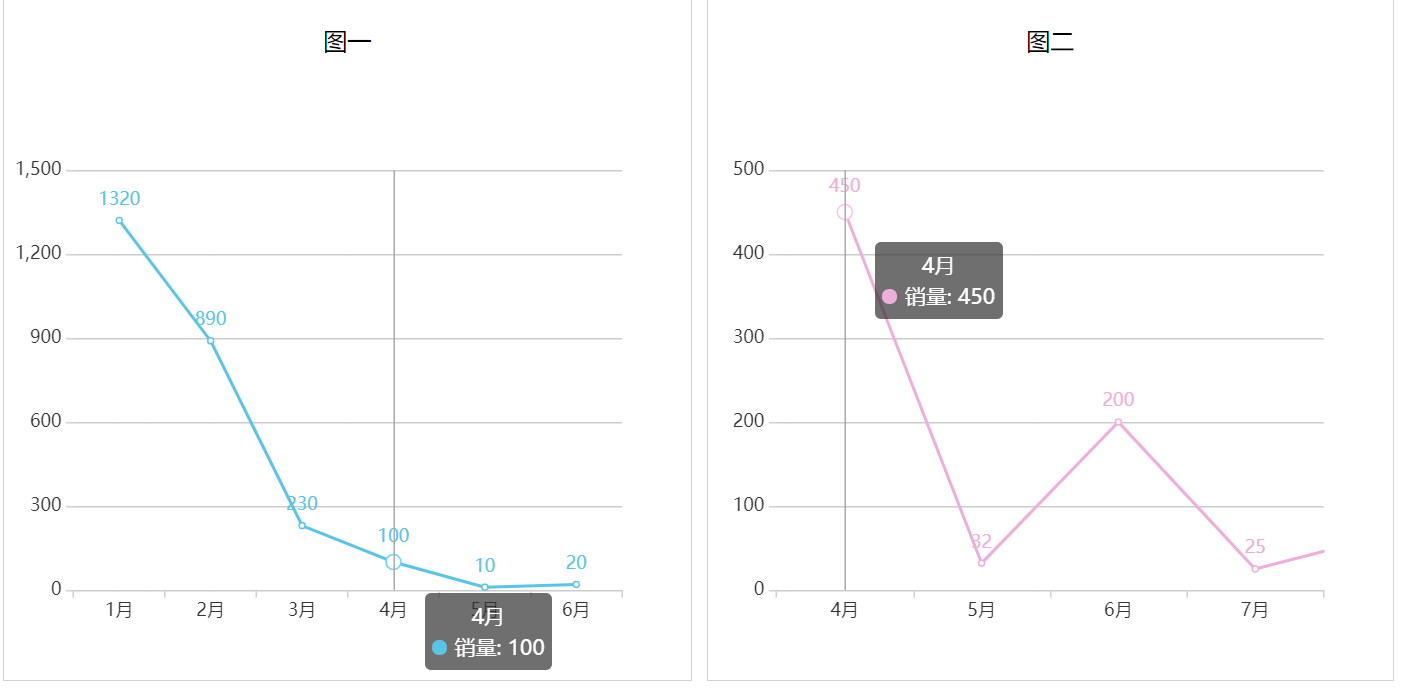
最近要实现echarts多图联动显示tooltip,如下图所示,当图一中移动到某月份显示tip,图二中的相同月份要同步显示tip。
主要实现的代码如下:
 setTooltip() {
      const myChart1 = this.charts[0].myChart;
      const myChart2 = this.charts[1].myChart;
      myChart1.on('mousemove', (params) => {
        // 这里不直接用params.dataIndex是因为可能两个图表X轴的月份数据点不一致
        const dataIndex = this.charts[1].data.xAxis.findIndex(x => x === params.name);
        myChart2.dispatchAction({
          type: 'showTip',
          seriesIndex: 0,
          // 我用的echarts版本是4.8.0,用name而不用dataIndex时,不知道为什么tooltip不显示,所以这里用dataIndex
          // name: params.name
          dataIndex
        });
      })
    }
但是这里会有一个问题,就是仅当鼠标移动到图一的标记点时,图二才会同步显示tip,如下图:

这样不是很方便,需要鼠标在图表中其他位置移动时也触发mousemove事件,具体代码如下:
 setTooltip() {
      const myChart1 = this.charts[0].myChart;
      const myChart2 = this.charts[1].myChart;
      myChart1.getZr().on('mousemove', (params) => {
        const pointInPixel = [params.offsetX, params.offsetY];
        // 判断当前鼠标移动的位置是否在图表中
        if (myChart1.containPixel('grid', pointInPixel)) {
          //使用 convertFromPixel方法 转换像素坐标值到逻辑坐标系上的点。获取点击位置对应的x轴数据的索引值
          const pointInGrid = myChart1.convertFromPixel({ seriesIndex: 0 }, pointInPixel);
          // x轴数据的索引值
          const xIndex = pointInGrid[0];
          // 使用getOption() 获取图表的option
          const op = myChart1.getOption();
          // 获取当前点击位置要的数据
          const xDate = op.xAxis[0].data[xIndex];
          // 这里不直接用params.dataIndex是因为可能两个图表X轴的月份数据点不一致
          const dataIndex = this.charts[1].data.xAxis.findIndex(x => x === xDate);
          myChart2.dispatchAction({
            type: 'showTip',
            seriesIndex: 0,
            // 我用的echarts版本是4.8.0,用name而不用dataIndex时,不知道为什么tooltip不显示,所以这里用dataIndex
            // name: params.name
            dataIndex
          });
        }
      })
  }
如下图所示,即鼠标在图表中移动时,即可触发另外的图表的showTip事件,而不仅仅通过移动到标记点触发

参考博文:
在Echarts区域的任何位置精准触发事件:https://https://www.shuzhiduo.com/A/obzbAV86dE/