import numpy as np
from sklearn.datasets import load_iris
data=load_iris()

petal_length=numpy.array(list(len[2]for len in data['data']))#取出花瓣长度数据
print(np.max(petal_length))#花瓣长度最大值
print(np.mean(petal_length))#花瓣长度平均值
print(np.std(petal_length))#花瓣长度的中值
print(np.median(petal_length))#花瓣长度的均方差
运行结果:

np.random.normal(1,5,100)#用np.random.normal()产生一个正态分布的随机数组,并显示出来
运行结果:

np.random.randn(3, 3)np.random.randn()#产生一个正态分布的随机数组,并显示出来。
运行结果为:

#显示鸢尾花花瓣长度的正态分布图
import numpy as np
import matplotlib.pyplot as plt
mu=np.mean(petal_length)
sigma=np.std(petal_length)
num=10000
rand_data = np.random.normal(mu, sigma, num)


count, bins, ignored = plt.hist(rand_data, 30, normed=True)
plt.plot(bins, 1 /(sigma * np.sqrt(2 * np.pi)) * np.exp(- (bins - mu) ** 2 / (2 * sigma ** 2)), linewidth = 2, color= "r")
plt.show()
运行结果为:

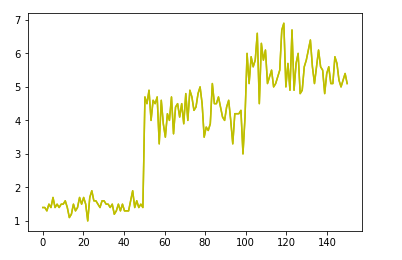
#显示鸢尾花花瓣长度的曲线图
plt.plot(np.linspace(0,150,num=150),petal_length,'y')
plt.show()
运行结果为:
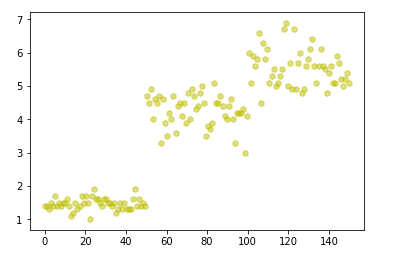
#显示鸢尾花花瓣长度的散点图
import numpy as np
import matplotlib.pyplot as plt
plt.scatter(np.linspace(0,150,num=150),petal_length,alpha=0.5,marker='h',color='y')
plt.show()
运行结果为: