===================================================
常用算法:二分-K均值算法
聚类的两个基本问题:性能度量和距离计算
===================================================
“无监督学习”代表性任务:聚类,密度估计,异常检测
一、聚类任务
1. 样本是未标记的
2. 聚类形成“簇” (cluster)
二、性能度量
两大类,“外部指标”与“内部指标”
1. “外部指标”,聚类的结果与“参考模型”(或者“专家模型”)的结果进行比较——
a, b, c, d满足a+b+c+d = m(m-1)/2.
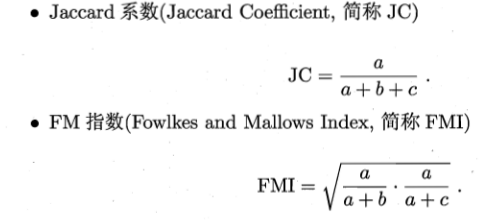
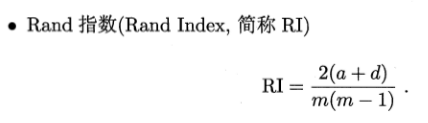
上述性能度量的结果均值在[0, 1]区间内,值越大越好。
2. “内部指标”,直接考察聚类结果而不利用任何参考模型
定义,
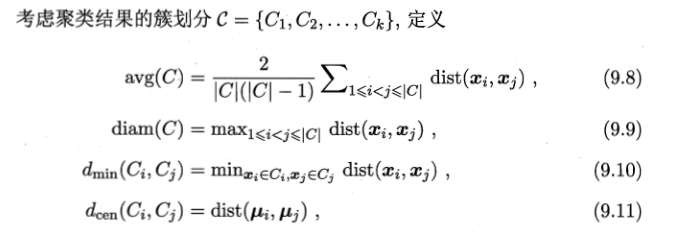
dist(., .)用于计算两个样本之间的距离,常用内部指标——

三、距离计算
当,
p=2时,闵可夫斯基距离即欧式距离
p=1时,为曼哈顿距离(各个维度上的绝对轴距总和)

上图摘自维基百科,红蓝黄皆为曼哈顿距离,绿色为欧式距离。
通常我们基于某种形式的距离来定义“相似度度量”,距离越大,相似度越小。
四、原型聚类
算法先对原型进行初始化,然后对原型进行迭代更新求解。
k均值聚类法(k-means)——

Python代码实现:参考《机器学习实战》
用到的库有numpy和matplotlib
KMeans.py文件
from numpy import *
import time
import matplotlib.pyplot as plt


# calculate Euclidean distance
def euclDistance(vector1, vector2):
    return sqrt(sum(power(vector2 - vector1, 2)))  #求这两个矩阵的距离,vector1、2均为矩阵

# init centroids with random samples
#在样本集中随机选取k个样本点作为初始质心
def initCentroids(dataSet, k):
    numSamples, dim = dataSet.shape   #矩阵的行数、列数
    centroids = zeros((k, dim))         #感觉要不要你都可以
    for i in range(k):
        index = int(random.uniform(0, numSamples))  #随机产生一个浮点数,然后将其转化为int型
        centroids[i, :] = dataSet[index, :]
    return centroids

# k-means cluster
#dataSet为一个矩阵
#k为将dataSet矩阵中的样本分成k个类
def kmeans(dataSet, k):
    numSamples = dataSet.shape[0]  #读取矩阵dataSet的第一维度的长度,即获得有多少个样本数据
    # first column stores which cluster this sample belongs to,
    # second column stores the error between this sample and its centroid
    clusterAssment = mat(zeros((numSamples, 2)))  #得到一个N*2的零矩阵
    clusterChanged = True

    ## step 1: init centroids
    centroids = initCentroids(dataSet, k)  #在样本集中随机选取k个样本点作为初始质心

    while clusterChanged:
        clusterChanged = False
        ## for each sample
        for i in range(numSamples):  #range
            minDist  = 100000.0
            minIndex = 0
            ## for each centroid
            ## step 2: find the centroid who is closest
            #计算每个样本点与质点之间的距离,将其归内到距离最小的那一簇
            for j in range(k):
                distance = euclDistance(centroids[j, :], dataSet[i, :])
                if distance < minDist:
                    minDist  = distance
                    minIndex = j

            ## step 3: update its cluster
            #k个簇里面与第i个样本距离最小的的标号和距离保存在clusterAssment中
            #若所有的样本不在变化,则退出while循环
            if clusterAssment[i, 0] != minIndex:
                clusterChanged = True
                clusterAssment[i, :] = minIndex, minDist**2  #两个**表示的是minDist的平方

        ## step 4: update centroids
        for j in range(k):
            #clusterAssment[:,0].A==j是找出矩阵clusterAssment中第一列元素中等于j的行的下标,返回的是一个以array的列表,第一个array为等于j的下标
            pointsInCluster = dataSet[nonzero(clusterAssment[:, 0].A == j)[0]] #将dataSet矩阵中相对应的样本提取出来
            centroids[j, :] = mean(pointsInCluster, axis = 0)  #计算标注为j的所有样本的平均值

    print ('Congratulations, cluster complete!')
    return centroids, clusterAssment

# show your cluster only available with 2-D data
#centroids为k个类别,其中保存着每个类别的质心
#clusterAssment为样本的标记,第一列为此样本的类别号,第二列为到此类别质心的距离
def showCluster(dataSet, k, centroids, clusterAssment):
    numSamples, dim = dataSet.shape
    if dim != 2:
        print ("Sorry! I can not draw because the dimension of your data is not 2!")
        return 1

    mark = ['or', 'ob', 'og', 'ok', '^r', '+r', 'sr', 'dr', '<r', 'pr']
    if k > len(mark):
        print ("Sorry! Your k is too large! ")
        return 1


    # draw all samples
    for i in range(numSamples):
        markIndex = int(clusterAssment[i, 0])  #为样本指定颜色
        plt.plot(dataSet[i, 0], dataSet[i, 1], mark[markIndex])

    mark = ['Dr', 'Db', 'Dg', 'Dk', '^b', '+b', 'sb', 'db', '<b', 'pb']
    # draw the centroids
    for i in range(k):
        plt.plot(centroids[i, 0], centroids[i, 1], mark[i], markersize = 12)

    plt.show()
测试文件test.py
from numpy import *
import time
import matplotlib.pyplot as plt
import KMeans

## step 1: load data
print ("step 1: load data..." )
dataSet = []   #列表,用来表示,列表中的每个元素也是一个二维的列表;这个二维列表就是一个样本,样本中包含有我们的属性值和类别号。
#与我们所熟悉的矩阵类似,最终我们将获得N*2的矩阵,
fileIn = open("D:/xuepython/testSet.txt")  #是正斜杠
for line in fileIn.readlines():
    temp=[]
    lineArr = line.strip().split('	')  #line.strip()把末尾的'
'去掉
    temp.append(float(lineArr[0]))
    temp.append(float(lineArr[1]))
    dataSet.append(temp)
    #dataSet.append([float(lineArr[0]), float(lineArr[1])])#上面的三条语句可以有这条语句代替
fileIn.close()
## step 2: clustering...
print ("step 2: clustering..."  )
dataSet = mat(dataSet)  #mat()函数是Numpy中的库函数,将数组转化为矩阵
k = 4
centroids, clusterAssment = KMeans.kmeans(dataSet, k)  #调用KMeans文件中定义的kmeans方法。

## step 3: show the result
print ("step 3: show the result..."  )
KMeans.showCluster(dataSet, k, centroids, clusterAssment)
运行结果图如下: 

上面是出现的两种聚类的结果。由于基本K均值聚类算法质心选择的随机性,其聚类的结果一般比较随机,一般不会很理想,最终结果往往出现自然簇无法区分的情况,为避免此问题,本文采用二分K均值聚类算法。
k-means算法分析
k-means算法比较简单,但也有几个比较大的缺点:
(1)k值的选择是用户指定的,不同的k得到的结果会有挺大的不同,如下图所示,左边是k=3的结果,这个就太稀疏了,蓝色的那个簇其实是可以再划分成两个簇的。而右图是k=5的结果,可以看到红色菱形和蓝色菱形这两个簇应该是可以合并成一个簇的:

(2)对k个初始质心的选择比较敏感,容易陷入局部最小值。例如,我们上面的算法运行的时候,有可能会得到不同的结果,如下面这两种情况。K-means也是收敛了,只是收敛到了局部最小值:

(3)存在局限性,如下面这种非球状的数据分布就搞不定了:

(4)数据库比较大的时候,收敛会比较慢。
k-means老早就出现在江湖了。所以以上的这些不足也被世人的目光敏锐的捕捉到,并融入世人的智慧进行了某种程度上的改良。例如问题(1)对k的选择可以先用一些算法分析数据的分布,如重心和密度等,然后选择合适的k。而对问题(2),有人提出了另一个成为二分k均值(bisecting k-means)算法,它对初始的k个质心的选择就不太敏感,这个算法我们下一个博文再分析和实现。
五、密度聚类
代表性算法:DBSCAN

六、层次聚类
代表性算法:AGNES
