REF
https://www.zhihu.com/question/51745620
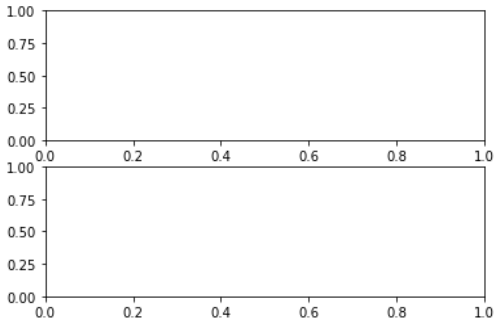
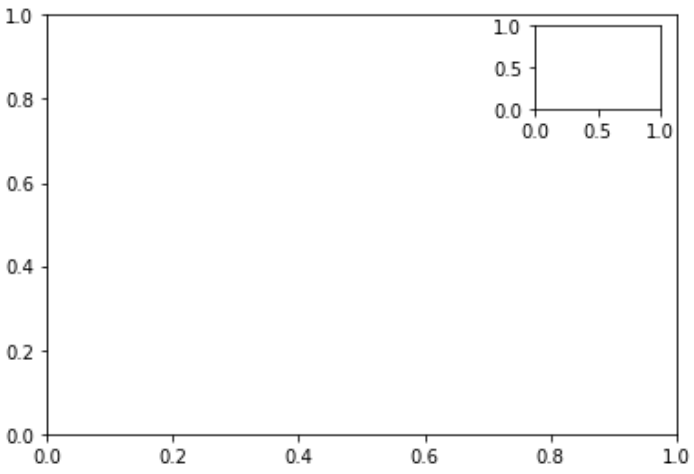
import matplotlib.pyplot as plt

fig = plt.figure(1)
ax1 = fig.add_subplot(211)
ax2 = fig.add_subplot(212)
print(type(ax1)) # <class 'matplotlib.axes._subplots.AxesSubplot'>
plt.show()


import matplotlib.pyplot as plt

fig = plt.figure(2)
ax3 = fig.add_axes([0.1, 0.1, 0.8, 0.8])
ax4 = fig.add_axes([0.72,0.72,0.16,0.16])
print(type(ax3))  # <class 'matplotlib.axes._axes.Axes'>
plt.show()
可以把figure想象成windows的桌面,你可以有好几个桌面。然后axes就是桌面上的图标,subplot也是图标,他们的区别在:axes是自由摆放的图标,甚至可以相互重叠,而subplot是“自动对齐到网格”。但他们本质上都是图标,也就是说subplot内部其实也是调用的axes,只不过规范了各个axes的排列罢了。
Most of you are probably familiar with the Subplot, which is just a special case of an Axes that lives on a regular rows by columns grid of Subplot instances. If you want to create an Axes at an arbitrary location, simply use the add_axes() method which takes a list of [left, bottom, width, height] values in 0-1 relative figure coordinates:
Matlab里面的概念:
https://ww2.mathworks.cn/help/matlab/ref/figure.html?s_tid=doc_ta
figure 使用默认属性值创建一个新的图窗窗口。生成的图窗为当前图窗。
https://ww2.mathworks.cn/help/matlab/ref/plot.html?s_tid=doc_ta
plot( 创建 X,Y)Y 中数据对 X 中对应值的二维线图。
https://ww2.mathworks.cn/help/matlab/ref/subplot.html?s_tid=doc_ta
subplot( 将当前图窗划分为 m,n,p)m×n 网格,并在 p 指定的位置创建坐标区。MATLAB® 按行号对子图位置进行编号。第一个子图是第一行的第一列,第二个子图是第一行的第二列,依此类推。如果指定的位置已存在坐标区,则此命令会将该坐标区设为当前坐标区。
https://ww2.mathworks.cn/help/matlab/ref/axis.html?s_tid=doc_ta
axis( 指定当前坐标区的范围。以包含 4 个、6 个或 8 个元素的向量形式指定范围。limits)
https://ww2.mathworks.cn/help/matlab/ref/axes.html?s_tid=doc_ta
axes 在当前图窗中创建默认的笛卡尔坐标区,并将其设置为当前坐标区。通常情况下,您不需要在绘图之前创建坐标区,因为如果不存在坐标区,图形函数会在绘图时自动创建坐标区。