使用Gephi绘制动态网络图
研究课题是关于网络演化的,需要绘制网络动态的演化图,这里主要是边的演化,不同的边有不同的时间。虽然原本的Gephi有动态图的展示,但是Gephi功能太有限了,对图的颜色,节点大小等支持都不够,所以我这里采用Python+Gephi-Toolkit+Premire的方式完成绘制。这里重点在于Python和Gephi-ToolKit这两个,Premire只是将生成的不同时刻的Pdf文件合并成一个视频。
Python处理原始数据
我们的原始数据是一个三列的邻接表数据,三列分别为node1, node2, time,记录了一条边的时间。
0 608 2
1 248 1
1 466 1
1 586 1
2 262 1
3 263 1
Gephi识别的gexf格式的文件的格式,关于这个文件格式可在这个网页找到说明 https://gephi.org/gexf/format/
本质上就是一个xml文件,所以我们使用python中的lxml库来构建,操作xml,根据原始数据,生成相应的gexf文件。lxml的API见https://lxml.de/tutorial.html
首先我们根据原始数据生成一个edge_t字典,key为元组形式的边,value为边的生成时间:
# 构造edge_t词典
def plot_graph_static(data_path, out_path):
    edge_t = dict()
    with open(data_path, 'r') as f:
        for line in f:
            s = line.strip().split(' ')
            edge_t[(int(s[0]), int(s[1]))] = int(s[2])
        print("Edge_t complete!")
接下来就是构造gexf了,按照xml树形结构的方式构建即可。注意
-
gexf标签属性
'mode': 'static', 'defaultedgetype': 'undirected'即可 -
节点不要重复
-
需要给边额外增加一个属性,且这个属性和边的权重的值都为边的生成时间(从1开始),要想增加属性,应该在graph标签下新增一个class为edge的attributes标签:
<?xml version='1.0' encoding='UTF-8'?>
<gexf xmlns:xsi="http://www.w3.org/2001/XMLSchema-instance" xmlns="http://www.gexf.net/1.3" version="1.3">
  <graph mode="static" defaultedgetype="undirected">
    <attributes class="edge">
      <attribute id="0" title="StartTime" type="string"/>
    </attributes>
然后在每个edge标签下新增一个attvalues标签:
<edge source="0" target="608" weight="2">
    <attvalues>
        <attvalue for="0" value="2"/>
    </attvalues>
</edge>
for属性的值对应之前attribute标签的id属性。之所以这么设置,是因为后面Gephi-Toolkit需要使用。
最终生成gexf文件的代码如下:
# xml 编写
    nsmap = {'xsi': 'http://www.w3.org/2001/XMLSchema-instance'}
    gexf = etree.Element('gexf', nsmap=nsmap)
    gexf.set('xmlns', 'http://www.gexf.net/1.3')
    gexf.set('version', '1.3')

    graph = etree.SubElement(gexf, 'graph', attrib={'mode': 'static', 'defaultedgetype': 'undirected'})

    attributes = etree.SubElement(graph, 'attributes', attrib={'class': 'edge'})
    edge_attr = etree.Element('attribute', attrib={'id': '0', 'title': 'StartTime', 'type': 'string'})
    attributes.append(edge_attr)

    nodes = etree.SubElement(graph, 'nodes')
    edges = etree.SubElement(graph, 'edges')

    node_list = []  # 保证节点不重复
    for edge in edge_t.keys():
        if edge[0] not in node_list:
            node_list.append(edge[0])
            xml_node = etree.Element('node', attrib={'id': str(edge[0]), 'label': str(edge[0])})
            nodes.append(xml_node)
        if edge[1] not in node_list:
            node_list.append(edge[1])
            xml_node = etree.Element('node', attrib={'id': str(edge[1]), 'label': str(edge[1])})
            nodes.append(xml_node)
        xml_edge = etree.Element('edge', attrib={'source': str(edge[0]), 'target': str(edge[1]),
                                                 'weight': str(edge_t[edge])})  # gephi中边权重不能<=0
        attvalues = etree.SubElement(xml_edge, 'attvalues')
        attvalue = etree.Element('attvalue', attrib={'for':'0', 'value':str(edge_t[edge])})
        attvalues.append(attvalue)
        edges.append(xml_edge)
    gexf_tree = etree.ElementTree(gexf)
    gexf_tree.write(out_path, pretty_print=True, xml_declaration=True, encoding='utf-8')
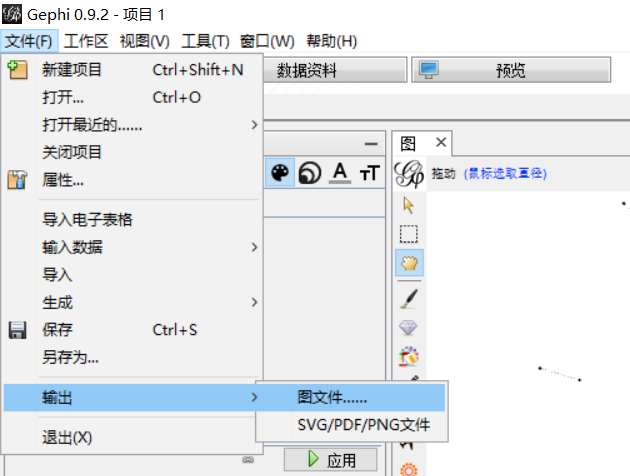
以上就是主要的代码了,我们记生成的文件为static.gexf,但是关于我们课题,我们需要比较两种不同的演化,所以这两种演化需要相同的布局,而且布局还要好看些,所以我们用Gephi打开static.gexf然后调整布局,节点大小,颜色(关键是布局,后面两个随便),然后输出图文件为gexf格式,命名为static_move.gexf
然后根据这个布局好了的static_move.gexf,我们根据同一个网络的另一个原始数据(时间不同,之前的是原始时间,这个是我们预测的时间),修改static_move.gexf里面的内容,注意
-
在获取标签时要注意xml是有命名空间的,
<gexf xmlns="http://www.gexf.net/1.3" version="1.3" xmlns:viz="http://www.gexf.net/1.3/viz" xmlns:xsi="http://www.w3.org/2001/XMLSchema-instance" xsi:schemaLocation="http://www.gexf.net/1.3 http://www.gexf.net/1.3/gexf.xsd">在使用iter迭代标签时要主要标签前需要有命名空间的部分,例如viz标签:<node id="608" label="608"> <viz:size value="100.0"></viz:size> <viz:position x="-2221.5906" y="-979.51196"></viz:position> <viz:color r="46" g="0" b="18"></viz:color> </node>我们迭代时就需要这么写
node.iter('{' + cur_nsmap['viz'] + '}' + 'color')即使是没有命名空间的标签,也是采用默认的命名空间的,迭代时这么写
root.iter('{' + cur_nsmap[None] + '}' + 'node') -
主要利用lxml对属性的set和get函数修改属性值。
所以这个在gexf文件中修改边时间的的代码:
def transfer_gexf(data_path, pattern_path, out_path):
    """
        根据pattern_path里的节点位置,大小等信息,结合datapath的时间信息,重新生成一个gexf文件
    """
    print("Transfering graph...")
    # 构造edge_t词典
    edge_t = dict()
    node_t = dict()
    with open(data_path, 'r') as f:
        for line in f:
            s = line.strip().split(' ')
            edge_t[(int(s[0]), int(s[1]))] = int(s[2])
            if int(s[0]) not in node_t.keys():
                node_t[int(s[0])] = int(s[2])
            if int(s[1]) not in node_t.keys():
                node_t[int(s[1])] = int(s[2])
        print("Edge_t complete!")

    with open(pattern_path, 'r') as f:
        gexf_tree = etree.parse(f)
        root = gexf_tree.getroot()
        cur_nsmap = root.nsmap
        for edge in root.iter('{' + cur_nsmap[None] + '}' + 'edge'):
            # print(edge)
            cur_edge_t = str(edge_t[(int(edge.get('source')), int(edge.get('target')))])
            edge.set('weight', cur_edge_t)
            for att in edge.iter('{' + cur_nsmap[None] + '}' + 'attvalue'):
                att.set('value' ,cur_edge_t)
        gexf_tree.write(out_path, pretty_print=True, xml_declaration=True, encoding='utf-8')
生成的gexf记为predict_static.gexf。我们最后是需要把predict_static.gexf, static_move.gexf都经过Gephi-Toolkit处理,然后生成一堆pdf文件的。所以流程都一样,只不过文件命名要区分一下。
Gephi-Toolkit处理gexf文件
我利用gephi-toolkit-demos来了解这个工具,API为https://gephi.org/gephi-toolkit/0.9.2/apidocs/
首先这是一个java程序,我们安装java1.8, 安装idea集成开发工具,下载maven(一个包管理工具),我参考https://www.jb51.net/article/122326.htm的前面部分内容进行了配置。配置完了后用idea打开gephi-toolkit-demos,右侧maven里面点clean,install安装需要的包。ps:我2020年4月时用还好好的,但是8月份我换电脑后移植过来就install失败,说有两个包在中央仓库(阿里云)找不到。(((φ(◎ロ◎;)φ))),所以我就把我原来电脑上的仓库拷贝复制到新电脑上了。
demo代码使用很简单,运行Main.java即可:
// Main.java
package org.gephi.toolkit.demos;

public class Main {

    public static void main(String[] args) {
        MineDynamic mineDynamic = new MineDynamic();
        mineDynamic.script();
    }
}
后面注释掉了原本的内容没有展示,MineDynamic是我自己根据demo新创建的类。
MineDynamic.java有6部分,
-
初始化,导入文件,准备工作(其实不是很懂,但主要改动就是导入的文件路径而已,其他不用管)
public void script() { //Init a project - and therefore a workspace ProjectController pc = Lookup.getDefault().lookup(ProjectController.class); pc.newProject(); Workspace workspace = pc.getCurrentWorkspace(); //Import file ImportController importController = Lookup.getDefault().lookup(ImportController.class); Container container; try { File file = new File(getClass().getResource("/org/gephi/toolkit/demos/bacteria/static_move.gexf").toURI()); container = importController.importFile(file); container.getLoader().setEdgeDefault(EdgeDirectionDefault.UNDIRECTED); } catch (Exception ex) { ex.printStackTrace(); return; } //Append imported data to GraphAPI importController.process(container, new DefaultProcessor(), workspace); //Prepare GraphModel graphModel = Lookup.getDefault().lookup(GraphController.class).getGraphModel(); AppearanceController appearanceController = Lookup.getDefault().lookup(AppearanceController.class); AppearanceModel appearanceModel = appearanceController.getModel(); FilterController filterController = Lookup.getDefault().lookup(FilterController.class); UndirectedGraph originGraph = graphModel.getUndirectedGraph(); System.out.println("OriginNodes: " + originGraph.getNodeCount()); System.out.println("OriginEdges: " + originGraph.getEdgeCount()); -
根据id为‘0’的属性划分边
//Partition with '0' column, which is in the data
        Column column = graphModel.getEdgeTable().getColumn("0");
        Function func = appearanceModel.getEdgeFunction(originGraph, column, PartitionElementColorTransformer.class);
        Partition partition = ((PartitionFunction) func).getPartition();
        System.out.println(partition.size() + " partitions found");
这里就用到之前生成gexf文件时,构建的edge的StartTime属性,id为‘0’.
-
根据划分的个数设置颜色(不同时刻边的颜色)
Object[] colors;
colors = GenColorBarItemByHSL(Color.CYAN, partition.size());
for (int p = 0; p < partition.size(); p++) {
    System.out.println(p);
    partition.setColor("" + (p + 1), (Color) colors[p]);
}
appearanceController.transform(func);
private Color[] GenColorBarItemByHSL(Color startColor, int num) { float[] hsb = Color.RGBtoHSB(startColor.getRed(), startColor.getGreen(), startColor.getBlue(), null); float hue = hsb[0]; float saturation = hsb[1]; float brightness = hsb[2]; Color[] colorList = new Color[num]; for (int i = 0; i < num; i++) { Color vColor = Color.getHSBColor((hue + (float)(i) / (float)(num)) % 1, saturation, brightness); colorList[i] = vColor; } return colorList; } -
对于每一个时刻, 根据边权重(和那个属性一样的值),过滤掉其他时刻的边,只显示当前时刻的边
for (double i = 1; i < partition.size() + 1; i++) { //Filter by weight EdgeWeightBuilder.EdgeWeightFilter edgeWeightFilter = new EdgeWeightBuilder.EdgeWeightFilter(); edgeWeightFilter.init(graphModel.getGraph()); edgeWeightFilter.setRange(new Range(0.0, i)); //Remove nodes with degree < 10 Query query = filterController.createQuery(edgeWeightFilter); GraphView view = filterController.filter(query); graphModel.setVisibleView(view); //Set the filter result as the visible view //Count nodes and edges on filtered graph UndirectedGraph graph = graphModel.getUndirectedGraphVisible(); System.out.println("Time:" + i + "Nodes: " + graph.getNodeCount() + " Edges: " + graph.getEdgeCount()); -
对于每一个时刻,因为不同权重的边生成图后边的粗细不同,所以我们需要存储当前的权重,然后把图的所有边权重都设为1,绘制完图后在将边的权重还原。
-
对于每一个时刻,设置输出图的一些属性(边宽),并输出成pdf
//Rank color by Degree(Set all node to Red)
Function degreeRanking = appearanceModel.getNodeFunction(graph, AppearanceModel.GraphFunction.NODE_DEGREE, RankingElementColorTransformer.class);
RankingElementColorTransformer degreeTransformer = (RankingElementColorTransformer) degreeRanking.getTransformer();
degreeTransformer.setColors(new Color[]{new Color(0xFF0000), new Color(0xFF0000)});
degreeTransformer.setColorPositions(new float[]{0f, 1f});
appearanceController.transform(degreeRanking);

//reset edge weight 1
Vector edgeWeights = new Vector();
Column weightCol = graphModel.getEdgeTable().getColumn("weight");
for (Edge n : graphModel.getGraph().getEdges()) {
    edgeWeights.add(n.getAttribute(weightCol));
    n.setAttribute(weightCol, new Double(1.0f));
}

//Preview
PreviewModel model = Lookup.getDefault().lookup(PreviewController.class).getModel();
model.getProperties().putValue(PreviewProperty.BACKGROUND_COLOR, Color.BLACK);
model.getProperties().putValue(PreviewProperty.SHOW_NODE_LABELS, Boolean.FALSE);
model.getProperties().putValue(PreviewProperty.EDGE_COLOR, new EdgeColor(EdgeColor.Mode.ORIGINAL));
model.getProperties().putValue(PreviewProperty.EDGE_THICKNESS, new Float(20f));
model.getProperties().putValue(PreviewProperty.EDGE_RESCALE_WEIGHT, Boolean.TRUE);
model.getProperties().putValue(PreviewProperty.NODE_LABEL_FONT, model.getProperties().getFontValue(PreviewProperty.NODE_LABEL_FONT).deriveFont(1));
//            model.getProperties().putValue(PreviewProperty.NODE_OPACITY, new Float(50f));
model.getProperties().putValue(PreviewProperty.NODE_BORDER_COLOR, new DependantColor(Color.RED));
model.getProperties().putValue(PreviewProperty.NODE_BORDER_WIDTH, new Float(1f));

//Export
ExportController ec = Lookup.getDefault().lookup(ExportController.class);
try {
    ec.exportFile(new File("./Result/bacteria/bacteria" + i + ".pdf"));
} catch (IOException ex) {
    ex.printStackTrace();
    return;
}

//restore edge weight
for (Edge n : graphModel.getGraph().getEdges()) {
    n.setAttribute(weightCol, edgeWeights.firstElement());
    edgeWeights.remove(0);
}
要想理解这些代码,最好还是跑下demo,看下代码,慢慢才能理解(但是Gephi-Toolkit有些看似能工作的代码其实没有效果,比如看上去我可以直接根据weight划分边嘛,为什么多此一举还要自己新建一个属性呢,我试过了,没用,这是我踩过的最大的坑了。)
8-6注:刚刚重新打开Gephi发现如果在gexf文件中边加了属性,可以直接通过软件改变边的颜色:
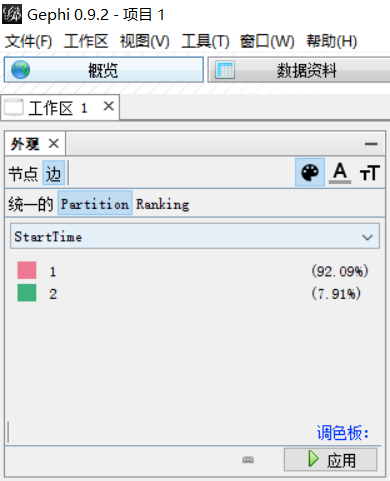
在软件右侧也可以直接通过过滤功能根据Weight过滤边。
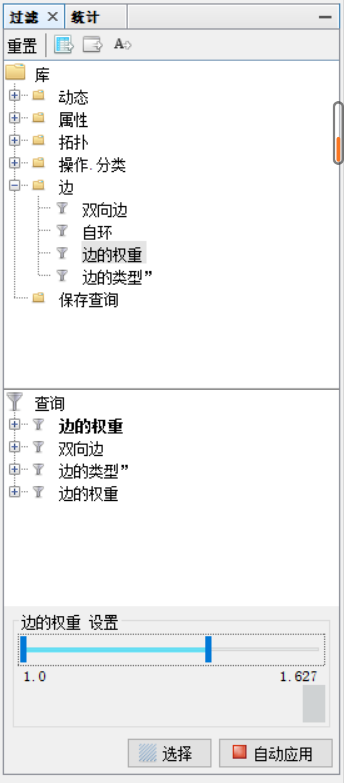
或许某种程度上简单的画图就不需要Gephi-Toolkit了。