ggplot2 盒图+显著性线
compire <- list(c('1','2'),c('1','4'))
ggplot(info,aes(x=cluster,y=value))+
stat_boxplot(geom = 'errorbar',width=0.2,lwd=2)+
geom_boxplot(lwd=1)+
geom_signif(comparisons = compire,test = t.test,step_increase = 0.1,map_signif_level = T,size = 1.5,textsize = 10,vjust = 0.5,color='black')+
geom_jitter(position=position_jitter(0.2),lwd=3,shape=19,aes(color=cluster))+
scale_color_manual(values=c("#374E55FF","#DF8F44FF","#00A1D5FF","#B24745FF"))+
theme_classic()+
theme(axis.text = element_text(size=30,color = 'black'),axis.title.y = element_text(size = 30),legend.position="none",plot.title = element_text(hjust = 0.5,size = 25)) + xlab('') + ylab('')+
ggtitle('Demo')
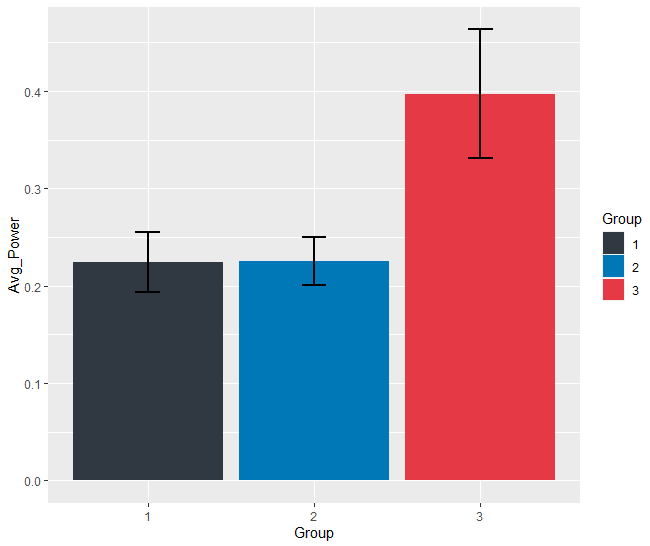
ggplot2 使用stat_summary画带误差线的bar图,自动计算均值和标准差
p <-ggplot(info,aes(x=Group,y=Avg_Power,fill=Group))
p + geom_bar(stat = "summary",fun="mean",) +
  scale_fill_manual(values=c('#303841','#0077b6','#e63946'))+
  geom_errorbar(stat = "summary", width =0.15, size = 1)

ggplot(info, aes(Group, Avg_Power,fill=Group)) +
  stat_summary(fun = mean, geom = "bar") +
  scale_fill_manual(values=c('#303841','#0077b6','#e63946'))+
  stat_summary(fun.data = mean_se, geom = "errorbar",width=0.15,size=1)