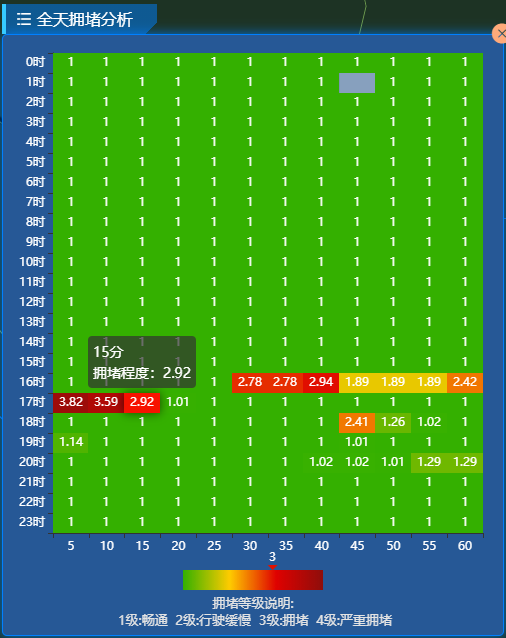
实现效果:

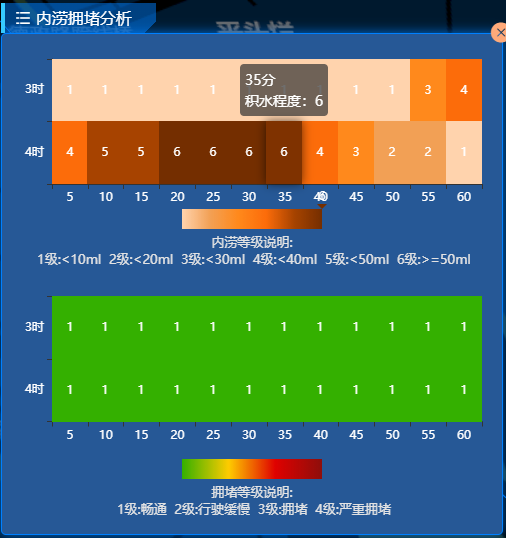
实际应用:
代码:
<!DOCTYPE html>
<html>
  <head>
    <meta charset="utf-8" />
    <title>ECharts</title>
    <script src="https://cdn.bootcss.com/echarts/4.2.1-rc1/echarts.min.js"></script>
  </head>

  <body>
    <div id="main" style=" 98%; height: 600px; margin-left: 1%"></div>
    <script type="text/javascript">
      var myChart = echarts.init(document.getElementById('main'))

      var days = [
        '12a',
        '1a',
        '2a',
        '3a',
        '4a',
        '5a',
        '6a',
        '7a',
        '8a',
        '9a',
        '10a',
        '11a',
        '12p',
        '1p',
        '2p',
        '3p',
        '4p',
        '5p',
        '6p',
        '7p',
        '8p',
        '9p',
        '10p',
        '11p'
      ]
      var hours = ['0-5', '6-10', '11-15', '15-20', '21-25', '26-30', '31-35']

      var data = [
        [0, 0, 5],
        [0, 1, 1],
        [0, 2, 0],
        [0, 3, 0],
        [0, 4, 0],
        [0, 5, 0],
        [0, 6, 0],
        [0, 7, 0],
        [0, 8, 0],
        [0, 9, 0],
        [0, 10, 0],
        [0, 11, 2],
        [0, 12, 4],
        [0, 13, 1],
        [0, 14, 1],
        [0, 15, 3],
        [0, 16, 4],
        [0, 17, 6],
        [0, 18, 4],
        [0, 19, 4],
        [0, 20, 3],
        [0, 21, 3],
        [0, 22, 2],
        [0, 23, 5],
        [1, 0, 7],
        [1, 1, 0],
        [1, 2, 0],
        [1, 3, 0],
        [1, 4, 0],
        [1, 5, 0],
        [1, 6, 0],
        [1, 7, 0],
        [1, 8, 0],
        [1, 9, 0],
        [1, 10, 5],
        [1, 11, 2],
        [1, 12, 2],
        [1, 13, 6],
        [1, 14, 9],
        [1, 15, 11],
        [1, 16, 6],
        [1, 17, 7],
        [1, 18, 8],
        [1, 19, 12],
        [1, 20, 5],
        [1, 21, 5],
        [1, 22, 7],
        [1, 23, 2],
        [2, 0, 1],
        [2, 1, 1],
        [2, 2, 0],
        [2, 3, 0],
        [2, 4, 0],
        [2, 5, 0],
        [2, 6, 0],
        [2, 7, 0],
        [2, 8, 0],
        [2, 9, 0],
        [2, 10, 3],
        [2, 11, 2],
        [2, 12, 1],
        [2, 13, 9],
        [2, 14, 8],
        [2, 15, 10],
        [2, 16, 6],
        [2, 17, 5],
        [2, 18, 5],
        [2, 19, 5],
        [2, 20, 7],
        [2, 21, 4],
        [2, 22, 2],
        [2, 23, 4],
        [3, 0, 7],
        [3, 1, 3],
        [3, 2, 0],
        [3, 3, 0],
        [3, 4, 0],
        [3, 5, 0],
        [3, 6, 0],
        [3, 7, 0],
        [3, 8, 1],
        [3, 9, 0],
        [3, 10, 5],
        [3, 11, 4],
        [3, 12, 7],
        [3, 13, 14],
        [3, 14, 13],
        [3, 15, 12],
        [3, 16, 9],
        [3, 17, 5],
        [3, 18, 5],
        [3, 19, 10],
        [3, 20, 6],
        [3, 21, 4],
        [3, 22, 4],
        [3, 23, 1],
        [4, 0, 1],
        [4, 1, 3],
        [4, 2, 0],
        [4, 3, 0],
        [4, 4, 0],
        [4, 5, 1],
        [4, 6, 0],
        [4, 7, 0],
        [4, 8, 0],
        [4, 9, 2],
        [4, 10, 4],
        [4, 11, 4],
        [4, 12, 2],
        [4, 13, 4],
        [4, 14, 4],
        [4, 15, 14],
        [4, 16, 12],
        [4, 17, 1],
        [4, 18, 8],
        [4, 19, 5],
        [4, 20, 3],
        [4, 21, 7],
        [4, 22, 3],
        [4, 23, 0],
        [5, 0, 2],
        [5, 1, 1],
        [5, 2, 0],
        [5, 3, 3],
        [5, 4, 0],
        [5, 5, 0],
        [5, 6, 0],
        [5, 7, 0],
        [5, 8, 2],
        [5, 9, 0],
        [5, 10, 4],
        [5, 11, 1],
        [5, 12, 5],
        [5, 13, 10],
        [5, 14, 5],
        [5, 15, 7],
        [5, 16, 11],
        [5, 17, 6],
        [5, 18, 0],
        [5, 19, 5],
        [5, 20, 3],
        [5, 21, 4],
        [5, 22, 2],
        [5, 23, 0],
        [6, 0, 1],
        [6, 1, 0],
        [6, 2, 0],
        [6, 3, 0],
        [6, 4, 0],
        [6, 5, 0],
        [6, 6, 0],
        [6, 7, 0],
        [6, 8, 0],
        [6, 9, 0],
        [6, 10, 1],
        [6, 11, 0],
        [6, 12, 2],
        [6, 13, 1],
        [6, 14, 3],
        [6, 15, 4],
        [6, 16, 0],
        [6, 17, 0],
        [6, 18, 0],
        [6, 19, 0],
        [6, 20, 1],
        [6, 21, 2],
        [6, 22, 2],
        [6, 23, 6]
      ]

      data = data.map(function (item) {
        return [item[0], item[1], item[2] || '-']
      })

      let option = {
        tooltip: {
          position: 'top'
        },
        animation: true,
        grid: {
          height: '50%',
          top: '10%'
        },
        xAxis: {
          type: 'category',
          data: hours,
          splitArea: {
            show: true
          }
        },
        yAxis: {
          type: 'category',
          data: days,
          splitArea: {
            show: true
          }
        },
        visualMap: {
          min: 0,
          max: 10,
          calculable: true,
          orient: 'horizontal',
          left: 'center',
          bottom: '15%'
        },
        series: [
          {
            name: '拥堵等级',
            type: 'heatmap',
            data: data,
            label: {
              show: true
            },
            emphasis: {
              itemStyle: {
                shadowBlur: 10,
                shadowColor: 'rgba(0, 0, 0, 0.5)'
              }
            }
          }
        ]
      }
      myChart.setOption(option)
    </script>
  </body>
</html>