1. 基本说明
使用Prometheus监控Windows主机和Linux主机并无太大区别,都是使用社区的Exporter进行采集数据,之后暴露一个接口,可以让Prometheus采集到主机的数据。
其中监控Linux的Exporter是:https://github.com/prometheus/node_exporter
监控Windows主机的Exporter是:https://github.com/prometheus-community/windows_exporter
2. 安装Windows Exporter
无论是监控Linux还是Windows,对应的exporter都提供了二进制文件和msi文件,Windows可以直接下载最新的msi文件,然后安装到对应的Windows主机上即可。
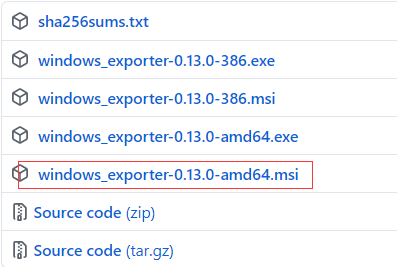
MSI文件下载地址:https://github.com/prometheus-community/windows_exporter/releases
下载对应的msi即可:
下载完成后,双击打开即可完成安装:

之后可以在任务管理器上看到对应的进程:

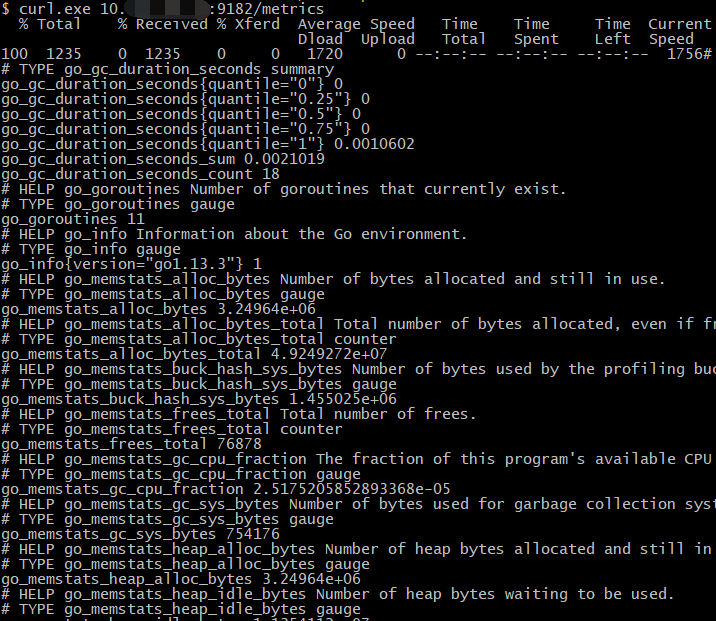
测试是否有数据产生,默认的端口为9182,path为metrics:
3. 配置Prometheus采集数据
在Prometheus的配置文件中添加如下配置:
- job_name: 'WindowsServerMonitor'
  static_configs:
    - targets:
      - "10.101.3.3:9182"
      labels:
        server_type: 'windows'
  relabel_configs:
    - source_labels: [__address__]
      target_label: instance
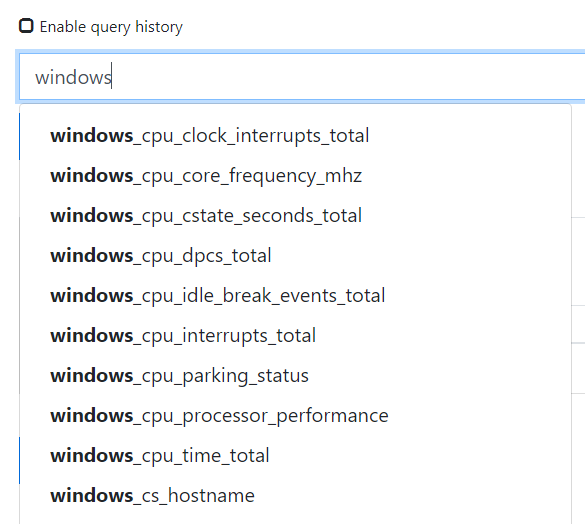
检查Prometheus是否有数据产生:
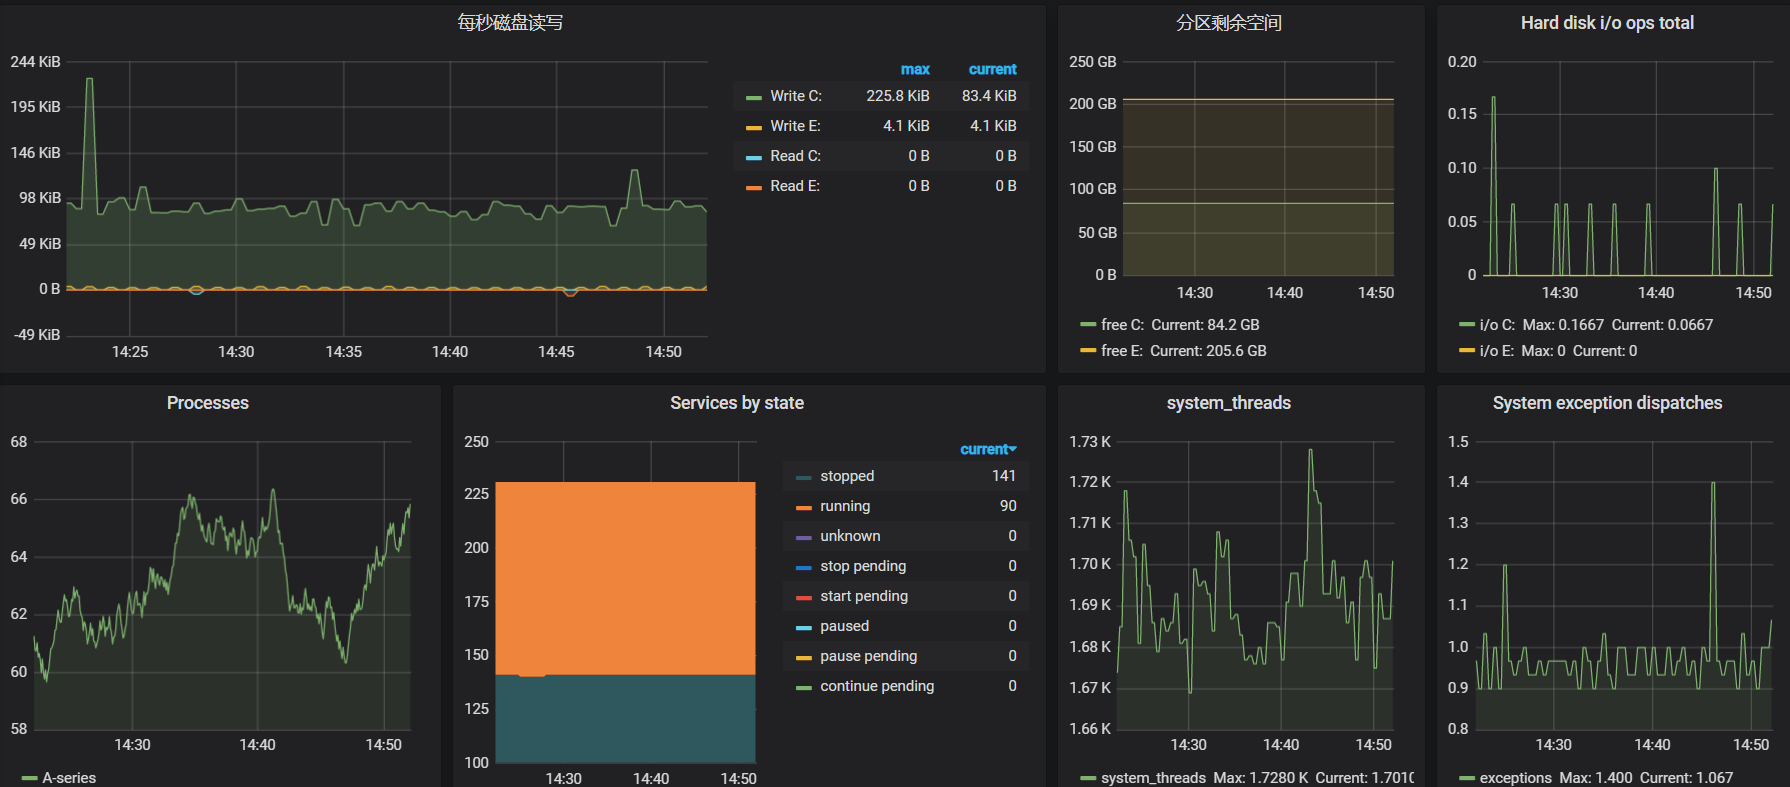
4. 配置Grafana展示数据
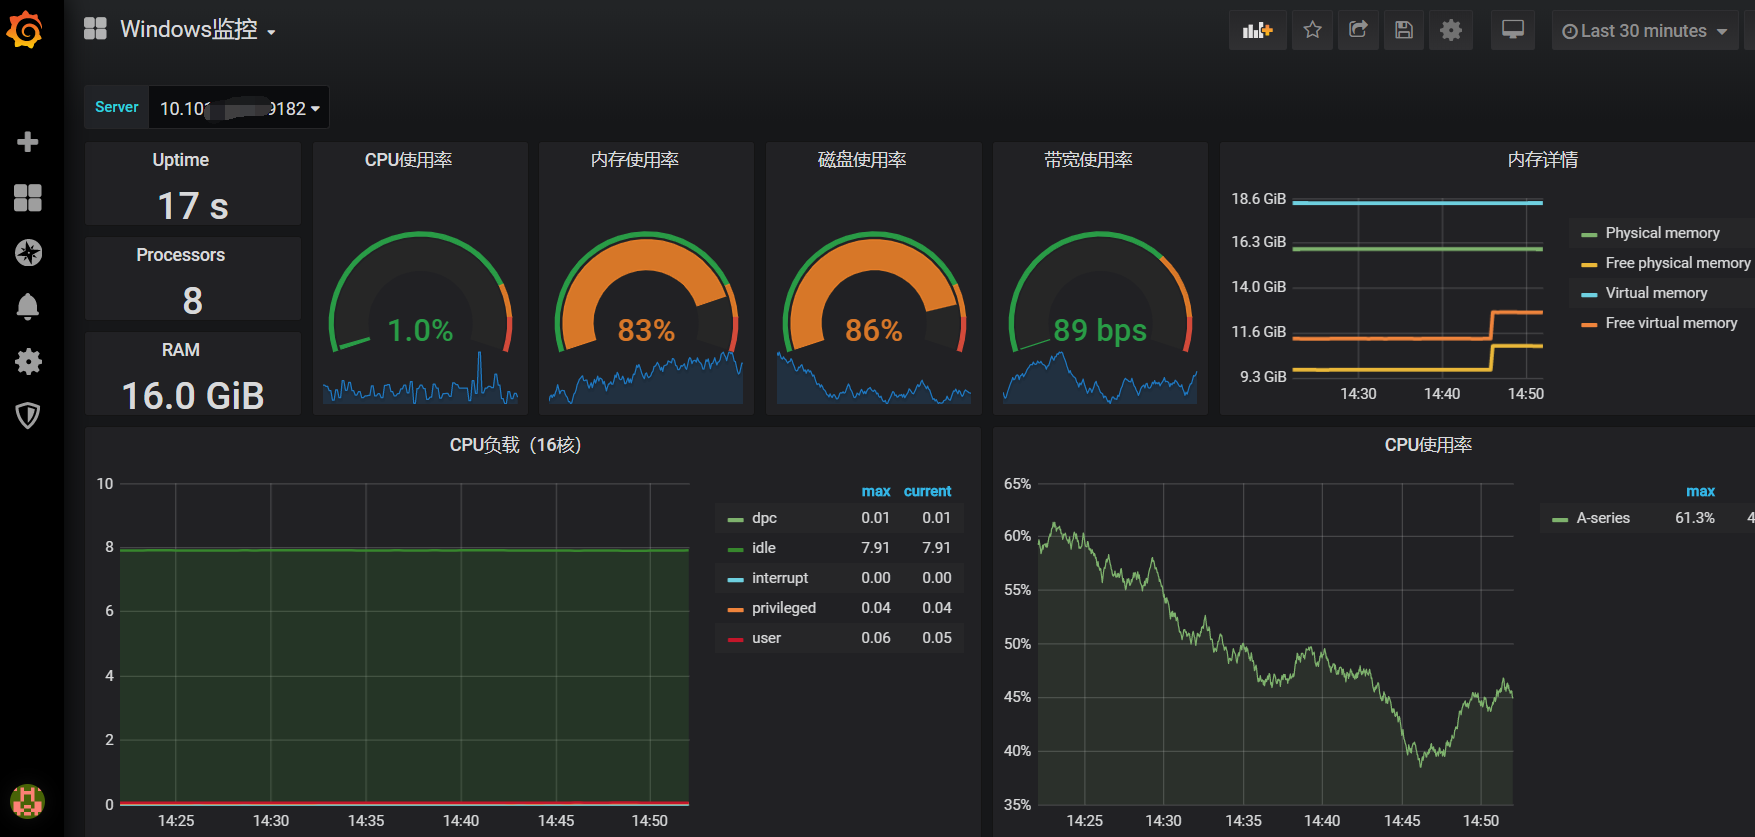
下载模板:https://grafana.com/grafana/dashboards/12566
数据展示如下:
欢迎大家学习2020年最新版kubernetes:https://ke.qq.com/course/2738602?from=800004101#term_id=102846072