number,density,sugercontent
1,0.697,0.460
2,0.774,0.376
3, 0.634,0.264
4,0.608,0.318
5,0.556,0.215
6,0.403,0.237
7,0.481,0.149
7,0.666,0.091
8,0.437,0.211
9,0.666,0.091
10,0.243,0.267
11,0.245,0.057
12,0.343,0.099
13,0.639,0.161
14,0.657,0.198
15,0.360,0.370
16,0.593,0.042
17,0.719,0.103
18,0.359,0.188
19,0.339,0.241
20,0.282,0.257
21,0.748,0.232
22,0.714,0.346
23,0.483,0.312
24,0.478,0.437
25,0.525,0.369
26,0.751,0.489
27,0.532,0.472
28,0.473,0.376
29,0.725,0.445
30,0.446,0.459
import numpy as np
import matplotlib.pyplot as plt
# Though the following import is not directly being used, it is required
# for 3D projection to work
from mpl_toolkits.mplot3d import Axes3D
from sklearn.cluster import KMeans
import pandas as pd
xigua = pd.read_csv('xigua.csv')
estimator = KMeans(n_clusters=3,max_iter=500,)
#计算每个样本的聚类中心并预测聚类索引。
a1=xigua.values
print(a1[:,1:3])
res = estimator.fit_predict(a1[:,1:3])
#每个点的标签
lable_pred = estimator.labels_
#每个点的聚类中心
centroids = estimator.cluster_centers_
#样本距其最近的聚类中心的平方距离之和。
inertia = estimator.inertia_
print (lable_pred)
print (centroids)
print (inertia)
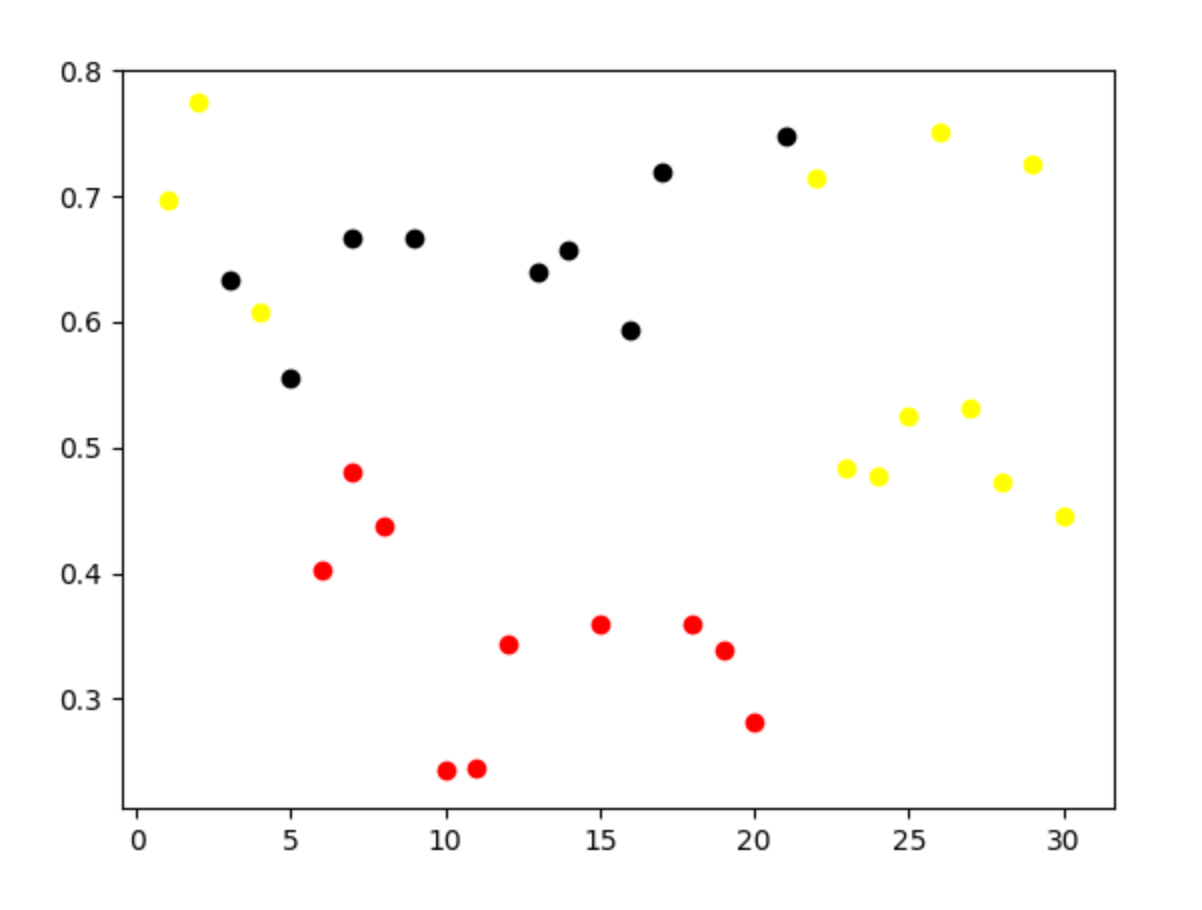
for i in range(len(a1)):
if int(lable_pred[i]) == 0:
plt.scatter(a1[i][0], a1[i][1], color='red')
if int(lable_pred[i]) == 1:
plt.scatter(a1[i][0], a1[i][1], color='black')
if int(lable_pred[i]) == 2:
plt.scatter(a1[i][0], a1[i][1], color='yellow')
plt.show()
打印参数
[2 2 1 2 1 0 0 1 0 1 0 0 0 1 1 0 1 1 0 0 0 1 2 2 2 2 2 2 2 2 2]
[[0.3492     0.2076    ]
 [0.65311111 0.15522222]
 [0.6005     0.40491667]]
0.41449036111111104


打印图片