Hadoop是对大数据集进行分布式计算的标准工具,这也是为什么当你穿过机场时能看到”大数据(Big Data)”广告的原因。它已经成为大数据的操作系统,提供了包括工具和技巧在内的丰富生态系统,允许使用相对便宜的商业硬件集群进行超级计算机级别的计算。2003和2004年,两个来自Google的观点使Hadoop成为可能:一个分布式存储框架(Google文件系统),在Hadoop中被实现为HDFS;一个分布式计算框架(MapReduce)。
这两个观点成为过去十年规模分析(scaling analytics)、大规模机器学习(machine learning),以及其他大数据应用出现的主要推动力!但是,从技术角度上讲,十年是一段非常长的时间,而且Hadoop还存在很多已知限制,尤其是MapReduce。对MapReduce编程明显是困难的。对大多数分析,你都必须用很多步骤将Map和Reduce任务串接起来。这造成类SQL的计算或机器学习需要专门的系统来进行。更糟的是,MapReduce要求每个步骤间的数据要序列化到磁盘,这意味着MapReduce作业的I/O成本很高,导致交互分析和迭代算法(iterative algorithms)开销很大;而事实是,几乎所有的最优化和机器学习都是迭代的。
为了解决这些问题,Hadoop一直在向一种更为通用的资源管理框架转变,即YARN(Yet Another Resource Negotiator, 又一个资源协调者)。YARN实现了下一代的MapReduce,但同时也允许应用利用分布式资源而不必采用MapReduce进行计算。通过将集群管理一般化,研究转到分布式计算的一般化上,来扩展了MapReduce的初衷。
一:Spark简介
官网:http://spark.apache.org/
Apache Spark™是用于大规模数据处理的统一分析引擎,是第一个脱胎于该转变的快速、通用分布式计算范式,并且很快流行起来。Spark使用函数式编程范式扩展了MapReduce模型以支持更多计算类型,可以涵盖广泛的工作流,这些工作流之前被实现为Hadoop之上的特殊系统。Spark使用内存缓存来提升性能,因此进行交互式分析也足够快速(就如同使用Python解释器,与集群进行交互一样)。缓存同时提升了迭代算法的性能,这使得Spark非常适合数据理论任务,特别是机器学习。
二:安装spark
因为Python常备用来做传统机器学习,深度学习的任务,为了它们相结合,我们使用python版spark.
安装 pip install pyspark

运行 pyspark ,还需java环境

配置完java环境,在运行pyspark

三:spark结合传统机器学习做数据分析
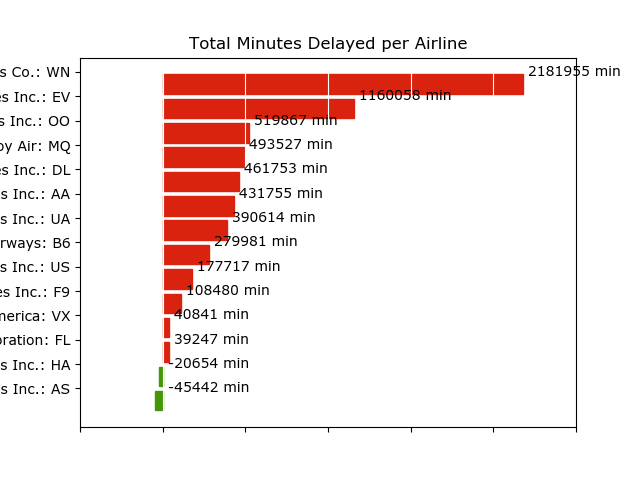
## Spark Application - execute with spark-submit

## Imports
import csv
import matplotlib.pyplot as plt

from io import StringIO
from datetime import datetime
from collections import namedtuple
from operator import add, itemgetter
from pyspark import SparkConf, SparkContext

## Module Constants
APP_NAME = "Flight Delay Analysis"
DATE_FMT = "%Y-%m-%d"
TIME_FMT = "%H%M"

fields = ('date', 'airline', 'flightnum', 'origin', 'dest', 'dep',
          'dep_delay', 'arv', 'arv_delay', 'airtime', 'distance')
Flight = namedtuple('Flight', fields)


## Closure Functions
def parse(row):
    """
    Parses a row and returns a named tuple.
    """

    row[0] = datetime.strptime(row[0], DATE_FMT).date()
    row[5] = datetime.strptime(row[5], TIME_FMT).time()
    row[6] = float(row[6])
    row[7] = datetime.strptime(row[7], TIME_FMT).time()
    row[8] = float(row[8])
    row[9] = float(row[9])
    row[10] = float(row[10])
    return Flight(*row[:11])


def split(line):
    """
    Operator function for splitting a line with csv module
    py2
    reader = csv.reader(StringIO(line))
    return reader.next()
    """
    reader = csv.reader(StringIO(line))
    return next(reader)


def plot(delays):
    """
    Show a bar chart of the total delay per airline
    """
    airlines = [d[0] for d in delays]
    minutes = [d[1] for d in delays]
    index = list(range(len(airlines)))

    fig, axe = plt.subplots()
    bars = axe.barh(index, minutes)

    # Add the total minutes to the right
    for idx, air, min in zip(index, airlines, minutes):
        if min > 0:
            bars[idx].set_color('#d9230f')
            axe.annotate(" %0.0f min" % min, xy=(min + 1, idx + 0.5), va='center')
        else:
            bars[idx].set_color('#469408')
            axe.annotate(" %0.0f min" % min, xy=(10, idx + 0.5), va='center')

    # Set the ticks
    ticks = plt.yticks([idx + 0.5 for idx in index], airlines)
    xt = plt.xticks()[0]
    plt.xticks(xt, [' '] * len(xt))

    # minimize chart junk
    plt.grid(axis='x', color='white', linestyle='-')

    plt.title('Total Minutes Delayed per Airline')
    plt.show()


## Main functionality
def main(sc):
    # Load the airlines lookup dictionary
    airlines = dict(sc.textFile("data/airlines.csv").map(split).collect())

    # Broadcast the lookup dictionary to the cluster
    airline_lookup = sc.broadcast(airlines)

    # Read the CSV Data into an RDD
    flights = sc.textFile("data/flights.csv").map(split).map(parse)

    # Map the total delay to the airline (joined using the broadcast value)
    delays = flights.map(lambda f: (airline_lookup.value[f.airline],
                                    add(f.dep_delay, f.arv_delay)))

    # Reduce the total delay for the month to the airline
    delays = delays.reduceByKey(add).collect()
    delays = sorted(delays, key=itemgetter(1))

    # Provide output from the driver
    for d in delays:
        print ("%0.0f minutes delayed	%s" % (d[1], d[0]))

    # Show a bar chart of the delays
    plot(delays)


if __name__ == "__main__":
    # Configure Spark
    conf = SparkConf().setMaster("local[*]")
    conf = conf.setAppName(APP_NAME)
    sc = SparkContext(conf=conf)

    # Execute Main functionality
    main(sc)
数据集下载:https://www.dropbox.com/s/gnzztknnhrx81uv/ontime.zip?dl=0
参考:https://www.cnblogs.com/Vito2008/p/5216324.html