SkyWalking方法级trace粒度实现 @Trace和apm-customize-enhance-plugin介绍
场景
在开发过程了,我们除了想知道链路的整体耗时以外,有的时候也想要知道某些方法的执行耗时。为了达到这个目的,我们需要做一些额外的配置。
今天就给大家介绍SkyWalking方法级trace的实现。
实现
SkyWalking方法级trace的实现具体分为侵入式和外部配置两种方式,各有优劣,可根据项目情况自行选择。首选给大家介绍侵入式实现方式。
一、侵入式实现
1、pom.xml依赖
  <dependency>
      <groupId>org.apache.skywalking</groupId>
      <artifactId>apm-toolkit-trace</artifactId>
      <version>${skywalking.version}</version>
   </dependency>
${skywalking.version} 和你当前使用的SkyWalking版本保持一致。
Methods annotated with @Tag will try to tag the current active span with the given key (Tag#key()) and (Tag#value()), if there is no active span at all, this annotation takes no effect.
根据官方文档的介绍,我们了解到可以使用@Tag注解实现方法级trace,@tag同时也包括key()和value()两个参数。同时必须保证方法在一个激活的span中,否则注解将不会起作用。
了解到基础用法以后,我们再接着往下看。下面的代码块中官方提供了基础的注解用例。
/**
 * The codes below will generate a span,
 * and two types of tags,
      one type tag: keys are `tag1` and `tag2`, values are the passed-in parameters, respectively,
      the other type tag: keys are `username`  and `age`, values are the return value in User, respectively
 */
@Trace
@Tag(key = "tag1", value = "arg[0]")
@Tag(key = "tag2", value = "arg[1]")
@Tag(key = "username", value = "returnedObj.username")
@Tag(key = "age", value = "returnedObj.age")
public User methodYouWantToTrace(String param1, String param2) {
    // ActiveSpan.setOperationName("Customize your own operation name, if this is an entry span, this would be an endpoint name");
    // ...
}
基础用法也了解完了,下面就开始我们的实践。
2、注解配置
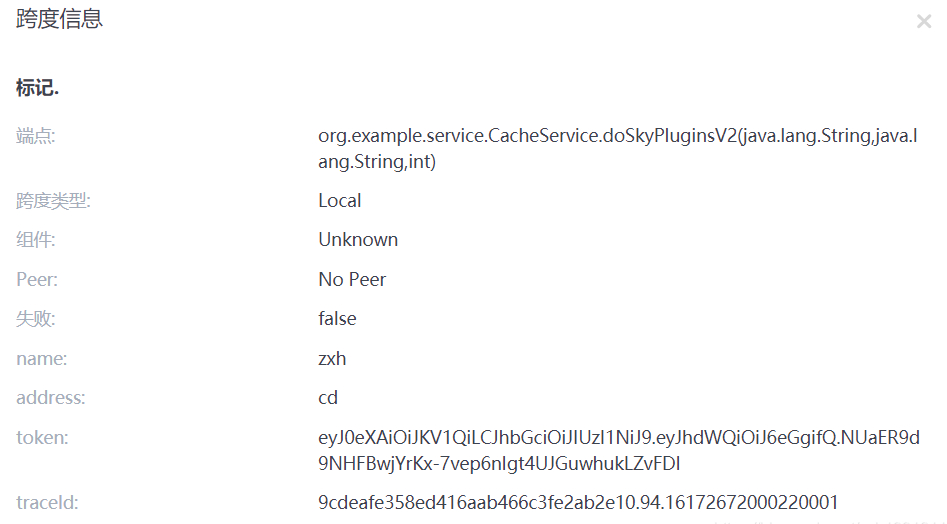
先在项目中引入依赖,然后再对应的方法上新增上注解。这里我们通过@Tag获取了name,address,token以及traceId参数。
    @Trace
    @Tags({@Tag(key = "name",value = "arg[0]"),
            @Tag(key = "token",value = "returnedObj.token"),
            @Tag(key = "address",value = "arg[1]"),
            @Tag(key = "traceId",value = "returnedObj.traceId")})
    public User doSkyWalkingPluginsV2(String name, String address, int id){
        CachaUser cachaUser = new CachaUser();
        cachaUser.setName(name);
        cachaUser.setAddress(address);
        cachaUser.setId(id);
        String token = TokenUtils.getToken(cachaUser);
        User user = new User();
        user.setAge("18");
        user.setName(name);
        user.setToken(token);
        user.setTraceId(TraceContext.traceId());
        return user;
    }
配置完成后,启动服务。通过postman远程调用服务,在skywalking服务页面可以看到,我们trace的doSkyWalkingPluginsV2方法也被收集到了,方法耗时也能一目了然。
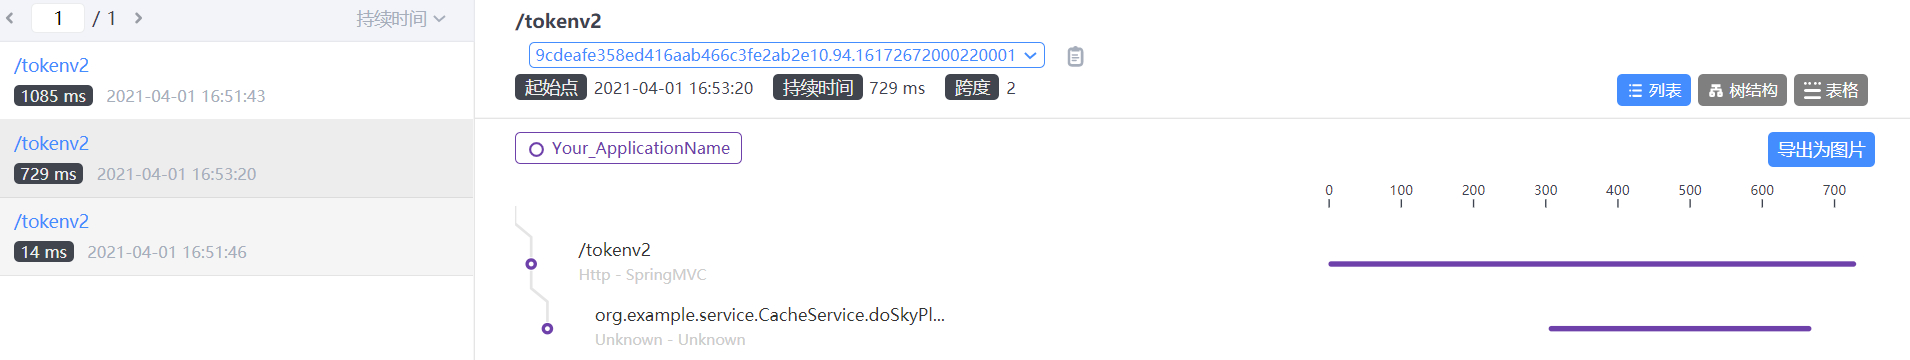
点击方法查看详情,name,address,token以及traceId参数也都全部被统计收集上来了。
去掉@Trace再试一次,这次只显示了接口链路,没有显示方法级别的trace粒度。
二、非侵入式实现
上面介绍了侵入式实现,侵入式实现需要我们引入pom.xml依赖,同时还需要对指定的方法配置注解。在某些场景下,我们对于监控的项目不方便修改,甚至无法修改的情况下,这个时候就要选择非侵入式方式来实现方法级的trace粒度追踪。
apm-customize-enhance-plugin插件作用:自定义增强任意类里的任意方法,从而实现对任意类里任意方法的监控。
1、移动apm-customize-enhance-plugin.jar
首先,找到skywalking的安装目录${path}\skywalking,${path}对于具体的文件目录
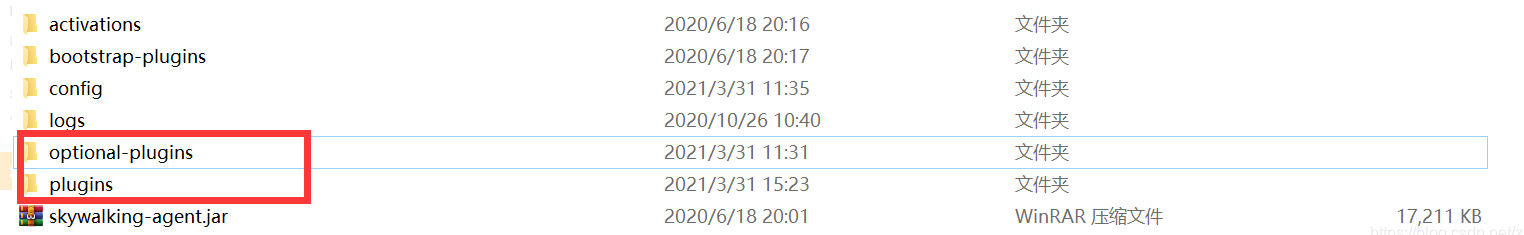
打开\apache-skywalking-apm-bin\agent目录,\optional-plugins\apm-customize-enhance-plugin.jar 移动到\plugin/apm-customize-enhance-plugin.jar
2、编写增强规则
举例,有个业务方法如下:
public class TestService1 {
    public static void staticMethod(String str0, int count, Map m, List l, Object[] os) {
      // 业务逻辑
    }
  ...
}
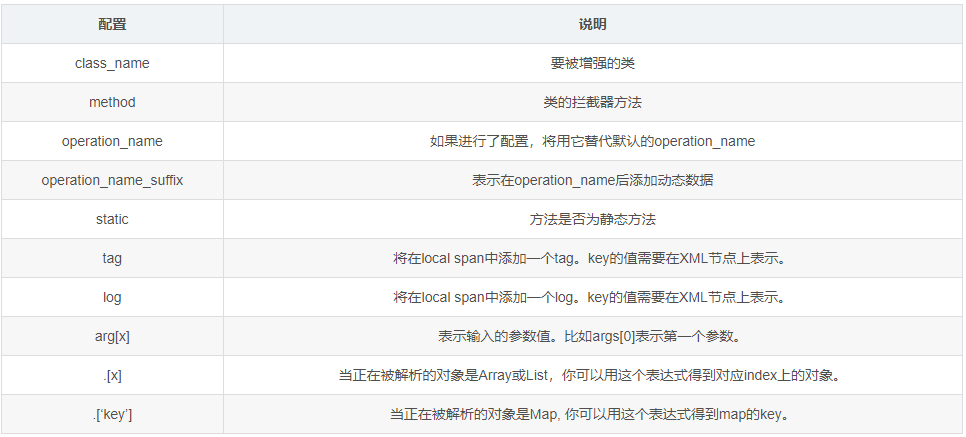
对如上方法,新建 customize_enhance.xml,xml的内容就需要如下配置,这里我们额外配置了name和address属性
<?xml version="1.0" encoding="UTF-8"?>
<enhanced>
    <class class_name="test.apache.skywalking.testcase.customize.service.TestService1">
        <method method="staticMethod(java.lang.String,int.class,java.util.Map,java.util.List,[Ljava.lang.Object;)" operation_name="/is_static_method_args" static="true">
            <operation_name_suffix>arg[0]</operation_name_suffix>
            <operation_name_suffix>arg[1]</operation_name_suffix>
            <operation_name_suffix>arg[3].[0]</operation_name_suffix>
            <tag key="tag_1">arg[2].['k1']</tag>
            <tag key="tag_2">arg[4].[1]</tag>
            <log key="log_1">arg[4].[2]</log>
        </method>
    </class>
</enhanced>
规则说明:
特别需要注意的是method的写法:
基本类型: 基本类型.class ,例如: int.class
非基本类型: 类的完全限定名称 ,例如:java.lang.String
数组:可以写个数组打印一下,就知道格式了,例如:
public static void main(String[] args) {
        String[] s = new String[]{};
        System.out.println(s);

        int [] x = new int []{};
        System.out.println(x);
    }
结果:
[Ljava.lang.String;@1b0375b3
[I@2f7c7260
通配符方式:
显示该类里所有静态方法(√)
    <?xml version="1.0" encoding="UTF-8"?>
    <enhanced>
    <class class_name="com.bx.bean.Order">
        <method method=".*()" static="true"/>
        <method method=".*(.*)" static="true"/>
    </class>
    </enhanced>
显示该类里所有以get开头的实例方法(√)
<?xml version="1.0" encoding="UTF-8"?>
    <enhanced>
        <class class_name="com.bx.bean.Order">
            <method method="get.*()" static="false"/>
            <method method="get.*(.*)" static="false"/>
        </class>
    </enhanced>
显示所有方法与get方法是否冲突(不冲突,只显示get方法)
   <?xml version="1.0" encoding="UTF-8"?>
    <enhanced>
        <class class_name="com.bx.bean.Order">
            <method method=".*()" static="false"/>
            <method method="get.*(.*)" static="false"/>
        </class>
    </enhanced>
3、配置agent.config中添加配置:
修改\config\agent.config文件,新增plugin.customize.enhance_file=${path}:\customize_enhance.xml,${path}对于具体的文件目录
例如:
plugin.customize.enhance_file=D:\soft\worksoft\skywalking\agent\config\customize_enhance.xml
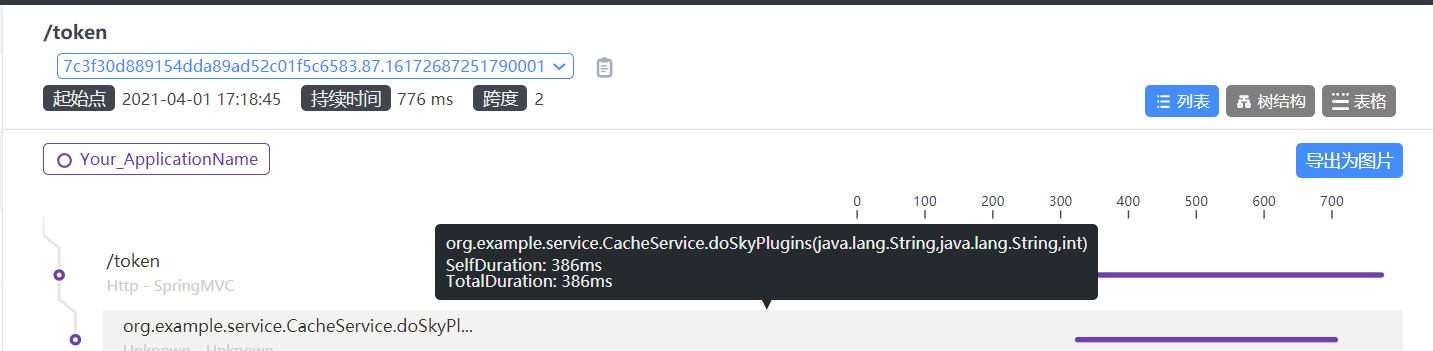
配置完成后,重新启动SkyWalking,重启服务。通过postman远程调用服务,在skywalking服务页面可以看到,我们trace的doSkyWalkingPlugins方法也被收集到了,方法耗时也能一目了然。
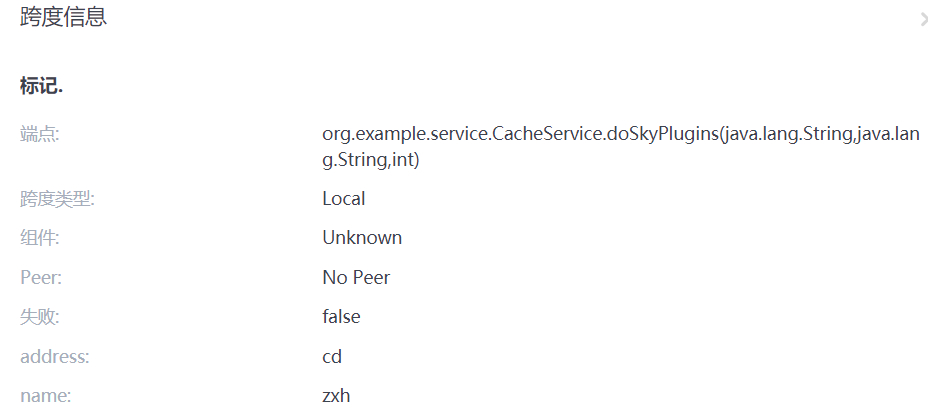
点击方法查看详情,name,address参数也都全部被统计收集上来了。
至此,两种方式实现方法级trace粒度的实现就全部介绍完了。
三、底层实现
@Trace为什么可以自定义监控指定方法
org.skywalking.apm.toolkit.activation.trace.TraceAnnotationActivation 类里:
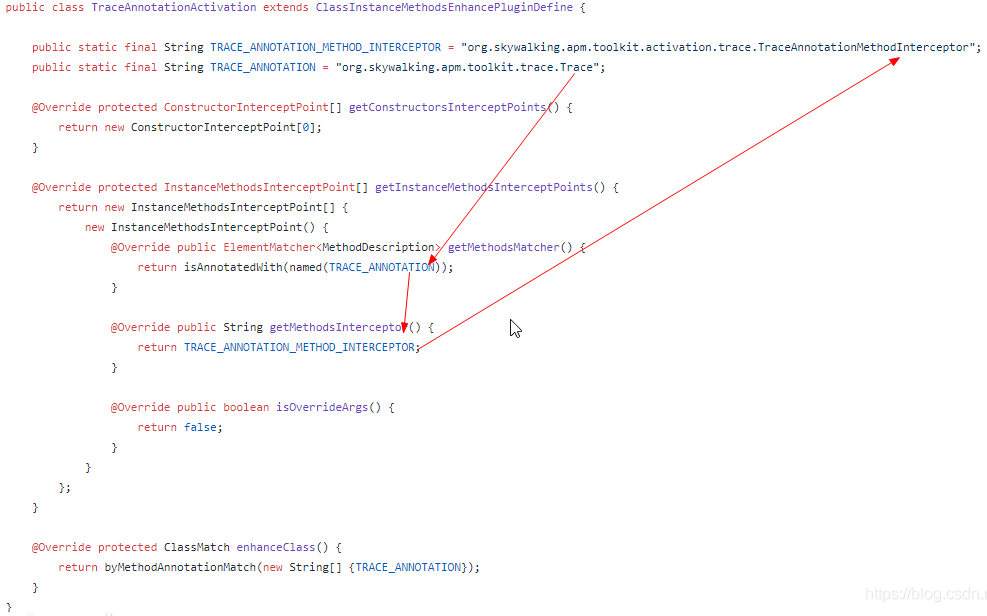
使用TraceAnnotationMethodInterceptor 拦截器
参考: