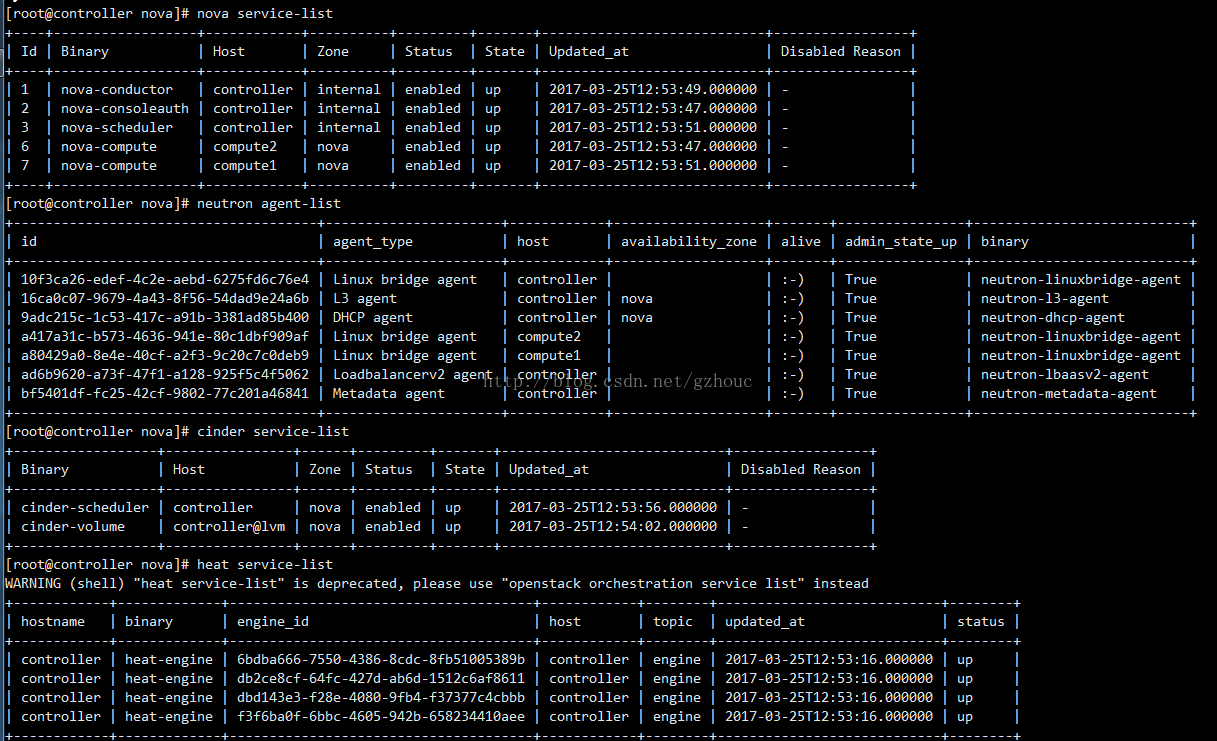
Openstack中的服务是分布式部署,因此,各个服务的启停状态,决定了此系统的可用性。我们可以
通过openstack提供的接口来查看服务的运行状态,比如:
nova service的相关配置
Nova相关的配置项都nova/conf这个目录下,如果我们相查看service相关的配置项,可以看nova/conf/service.py。其中,注意一下这两个配置项:
service_down_time
report_interval
具体作用可以查看注释。大概意思就是说,超过service_down_time的时间没有收到的心跳 的话,就认为服务是挂 了的,report_interval是定义了心跳的周期,即多长时间
上报一次自己的心跳。
nova服务的启动
nova-compute的服务的入口在nova/cmd/compute.py:main()
其中最重要的一行代码就是高亮的部分。这里首先会初始一个service.Service的类:
def main():
    config.parse_args(sys.argv)
    logging.setup(CONF, 'nova')
    priv_context.init(root_helper=shlex.split(utils.get_root_helper()))
    utils.monkey_patch()
    objects.register_all()
    # Ensure os-vif objects are registered and plugins loaded
    os_vif.initialize()

    gmr.TextGuruMeditation.setup_autorun(version)

    cmd_common.block_db_access('nova-compute')
    objects_base.NovaObject.indirection_api = conductor_rpcapi.ConductorAPI()

    server = service.Service.create(binary='nova-compute',
                                    topic=CONF.compute_topic)
    service.serve(server)
    service.wait()
我们详细看一下service.Service()这个类:
class Service(service.Service):
    """Service object for binaries running on hosts.

    A service takes a manager and enables rpc by listening to queues based
    on topic. It also periodically runs tasks on the manager and reports
    its state to the database services table.
    """

    def __init__(self, host, binary, topic, manager, report_interval=None,
                 periodic_enable=None, periodic_fuzzy_delay=None,
                 periodic_interval_max=None, *args, **kwargs):
        super(Service, self).__init__()
        self.host = host
        self.binary = binary
        self.topic = topic
        self.manager_class_name = manager
        self.servicegroup_api = servicegroup.API()
        manager_class = importutils.import_class(self.manager_class_name)
        self.manager = manager_class(host=self.host, *args, **kwargs)
        self.rpcserver = None
        self.report_interval = report_interval
        self.periodic_enable = periodic_enable
        self.periodic_fuzzy_delay = periodic_fuzzy_delay
        self.periodic_interval_max = periodic_interval_max
        self.saved_args, self.saved_kwargs = args, kwargs
        self.backdoor_port = None
        if objects_base.NovaObject.indirection_api:
            conductor_api = conductor.API()
            conductor_api.wait_until_ready(context.get_admin_context())
        setup_profiler(binary, self.host)
这里重点看一下高亮的部分,看到一个report_interval这个变量。还有一个servicegroup.API()。
接下来我们看一下serivce.Service的start()方法:
# Add service to the ServiceGroup membership group.
self.servicegroup_api.join(self.host, self.topic, self)
会看上面一行代码,这里调用了servicegroup_api中的join方法,具体路径在nova/servicegroup/api.py:join()
def join(self, member, group, service=None):
    """Add a new member to a service group.

    :param member: the joined member ID/name
    :param group: the group ID/name, of the joined member
    :param service: a `nova.service.Service` object
    """
    return self._driver.join(member, group, service)
从servicegroup.API()的初始化函数我们看到
class API(object):

    def __init__(self, *args, **kwargs):
        '''Create an instance of the servicegroup API.

        args and kwargs are passed down to the servicegroup driver when it gets
        created.
        '''
        # Make sure report interval is less than service down time
        report_interval = CONF.report_interval
        if CONF.service_down_time <= report_interval:
            new_service_down_time = int(report_interval * 2.5)
            LOG.warning(_LW("Report interval must be less than service down "
                            "time. Current config: <service_down_time: "
                            "%(service_down_time)s, report_interval: "
                            "%(report_interval)s>. Setting service_down_time "
                            "to: %(new_service_down_time)s"),
                        {'service_down_time': CONF.service_down_time,
                         'report_interval': report_interval,
                         'new_service_down_time': new_service_down_time})
            CONF.set_override('service_down_time', new_service_down_time)

        driver_class = _driver_name_class_mapping[CONF.servicegroup_driver]
        self._driver = importutils.import_object(driver_class,
                                                 *args, **kwargs)
回到nova/conf/servicegrouup.py中我们可以看到,CONF.servicegroup_driver目前只支持两个类型:
SERVICEGROUP_OPTS = [
    cfg.StrOpt('servicegroup_driver',
        default='db',
        choices=['db', 'mc'],
        help="""
This option specifies the driver to be used for the servicegroup service.

ServiceGroup API in nova enables checking status of a compute node. When a
compute worker running the nova-compute daemon starts, it calls the join API
to join the compute group. Services like nova scheduler can query the
ServiceGroup API to check if a node is alive. Internally, the ServiceGroup
client driver automatically updates the compute worker status. There are
multiple backend implementations for this service: Database ServiceGroup driver
and Memcache ServiceGroup driver.

Possible Values:

    * db : Database ServiceGroup driver
    * mc : Memcache ServiceGroup driver

Related Options:

    * service_down_time (maximum time since last check-in for up service)
"""),
]
我们假定用的是db这种方式,因此,我们要找的join方法应该在nova/securitygroup/drivers/db.py中:
def join(self, member, group, service=None):
    """Add a new member to a service group.

    :param member: the joined member ID/name
    :param group: the group ID/name, of the joined member
    :param service: a `nova.service.Service` object
    """
    LOG.debug('DB_Driver: join new ServiceGroup member %(member)s to '
              'the %(group)s group, service = %(service)s',
              {'member': member, 'group': group,
               'service': service})
    if service is None:
        raise RuntimeError(_('service is a mandatory argument for DB based'
                             ' ServiceGroup driver'))
    report_interval = service.report_interval
    if report_interval:
        service.tg.add_timer(report_interval, self._report_state,
                             api.INITIAL_REPORTING_DELAY, service)
在这里我们很容易发现了他的回调函数:self._report_state()
def _report_state(self, service):
    """Update the state of this service in the datastore."""

    try:
        service.service_ref.report_count += 1
        service.service_ref.save()

        # TODO(termie): make this pattern be more elegant.
        if getattr(service, 'model_disconnected', False):
            service.model_disconnected = False
            LOG.info(
                _LI('Recovered from being unable to report status.'))
其中service是从数据库中取得的最新service数据,该函数只是仅仅把report_count加一,然后调用save方法保存到数据库中。这里需要注意的是,save方法每次都会记录更新的时间,在数据库的字段为updated_at。
由此,nova服务的心跳机制,本质就是每隔一段时间往数据库更新report_count值,并记录最后更新时间作为接收到的最新心跳时间戳。
这个值可以从数据库中查到,如下: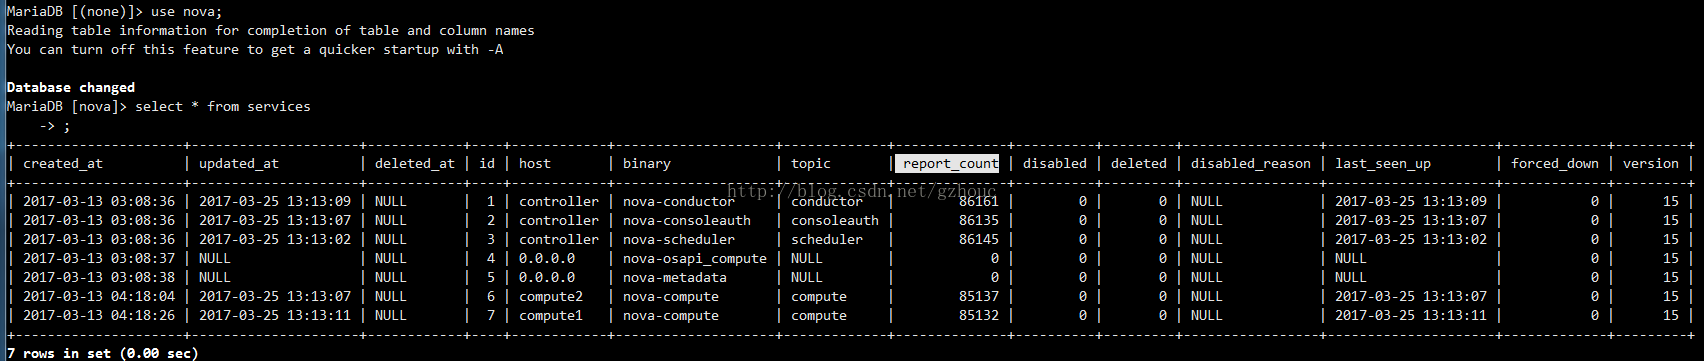
服务状态监控机制
我们从nova-api的分析入手。其中与service相关的代码位于: nova/api/openstack/compute/services.py。当我们调用nova service-list的命令时,实际是调用:
1. nova/api/openstack/compute/serivces.py: index()
@extensions.expected_errors(())
def index(self, req):
    """Return a list of all running services. Filter by host & service
    name
    """
    if api_version_request.is_supported(req, min_version='2.11'):
        _services = self._get_services_list(req, ['forced_down'])
    else:
        _services = self._get_services_list(req)

    return {'services': _services}
2. nova/api/openstack/compute/serivces.py: _get_services_list():
def _get_services_list(self, req, additional_fields=()):
    _services = self._get_services(req)
    return [self._get_service_detail(svc, additional_fields)
            for svc in _services]
3. nova/api/openstack/compute/serivces.py: _get_services_detail():
def _get_service_detail(self, svc, additional_fields):
    alive = self.servicegroup_api.service_is_up(svc)
    state = (alive and "up") or "down"
    active = 'enabled'
    if svc['disabled']:
        active = 'disabled'
    service_detail = {'binary': svc['binary'],
                      'host': svc['host'],
                      'id': svc['id'],
                      'zone': svc['availability_zone'],
                      'status': active,
                      'state': state,
                      'updated_at': svc['updated_at'],
                      'disabled_reason': svc['disabled_reason']}

    for field in additional_fields:
        service_detail[field] = svc[field]

    return service_detail
nova/servicegroup/api.py
def service_is_up(self, member):
    """Check if the given member is up."""
    # NOTE(johngarbutt) no logging in this method,
    # so this doesn't slow down the scheduler
    if member.get('forced_down'):
        return False

    return self._driver.is_up(member)
nova/serivcegroup/drivers/db.py
def is_up(self, service_ref):
    """Moved from nova.utils
    Check whether a service is up based on last heartbeat.
    """
    last_heartbeat = (service_ref.get('last_seen_up') or
        service_ref['created_at'])
    if isinstance(last_heartbeat, six.string_types):
        # NOTE(russellb) If this service_ref came in over rpc via
        # conductor, then the timestamp will be a string and needs to be
        # converted back to a datetime.
        last_heartbeat = timeutils.parse_strtime(last_heartbeat)
    else:
        # Objects have proper UTC timezones, but the timeutils comparison
        # below does not (and will fail)
        last_heartbeat = last_heartbeat.replace(tzinfo=None)
    # Timestamps in DB are UTC.
    elapsed = timeutils.delta_seconds(last_heartbeat, timeutils.utcnow())
    is_up = abs(elapsed) <= self.service_down_time
    if not is_up:
        LOG.debug('Seems service %(binary)s on host %(host)s is down. '
                  'Last heartbeat was %(lhb)s. Elapsed time is %(el)s',
                  {'binary': service_ref.get('binary'),
                   'host': service_ref.get('host'),
                   'lhb': str(last_heartbeat), 'el': str(elapsed)})
    return is_up
看到高亮的部分,我们就很容易明白,nova是如何判断一个服务是up还是down的了:
首先获取service实例的最后更新时间戳,即最后心跳时间,然后计算最后心跳时间距离现在时间的间隔,如果小于等于service_down_time的值,则认为服务是up的,否则是down。
比如假设我们设置的report_interval时间为10秒,正常的话检查最后心跳到当前时间一定小于10秒,不幸的是可能中间丢了2个心跳,那检查的最后心跳距离当前时间可能为20多秒,由于小于我们的service_down_time(假设为60秒),因此还是认为服务是up的。如果连续丢掉超过6个心跳包,则服务就会返回down了。
问题分析
当Openstack不正常工作时,首先查看下服务状态,比如执行nova service-list命令查看Nova相关的服务状态。
如果服务状态为down,根据Openstack服务的心跳机制和状态监控原理,可能有以下几种故障情形:
1. 数据库访问错误导致心跳更新失败,这种情况看日志就能发现错误日志。
2. Rabbitmq连接失败,nova-compute不能直接访问数据库,更新时是通过RPC调用nova-conductor完成的,如果rabbitmq连接失败,RPC将无法执行,导致心跳发送失败。
3. nova-conductor故障,原因同上,不过这种情况概率很低,除非人为关闭了该服务。
4. 时间不同步。这种情况排查非常困难,因为你在日志中是发现不了任何错误信息的,我们知道数据库操作由nova-conductor组件完成的,而计算心跳间隔是在nova-api服务完成的,假如这两个服务所在的主机时间不同步,将可能导致服务误判为down。对于多API节点部署时尤其容易出现这种情况,所有节点务必保证时间同步,NTP服务必须能够正常工作,否则将影响Openstack服务的心跳机制和状态监控。
nova的这种上报方式其实这种方法效率是非常低的,并且当服务众多时,数据库的压力将会非常大,因此有人提出引入Zookeeper服务发现机制维护Openstack服务状态,参考Services Heartbeat with ZooKeeper。