论文链接:https://arxiv.org/pdf/1701.08546.pdf
先上个大图吸引眼球
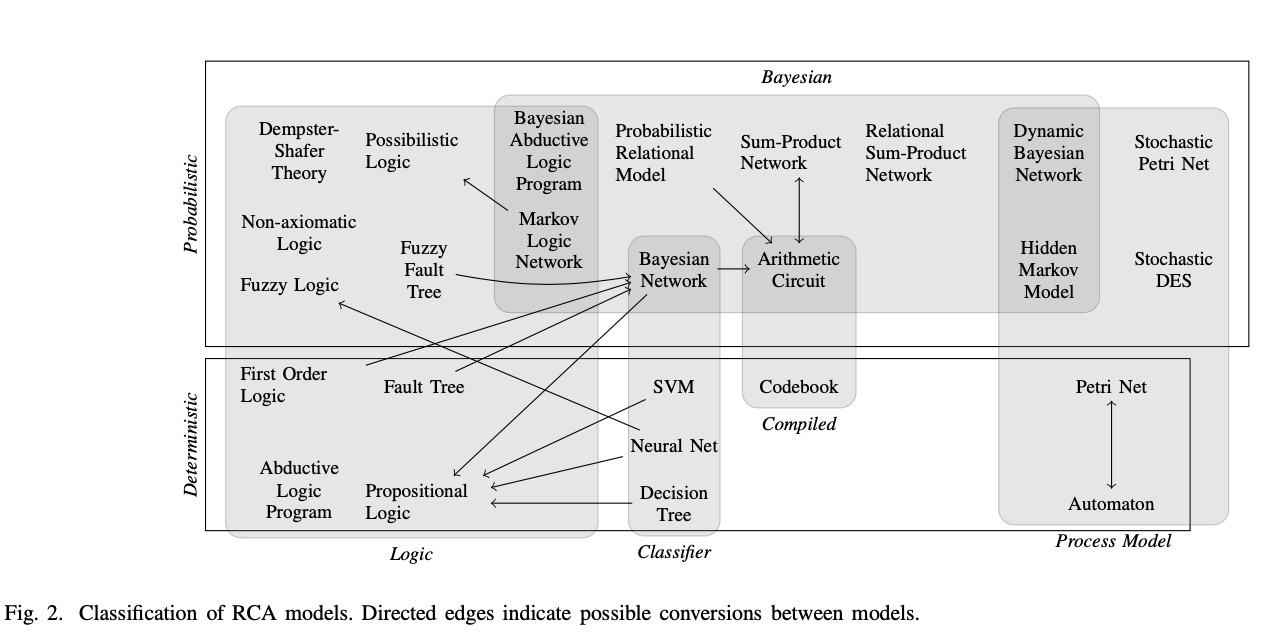
RCA是一个在多行业应用的工业实践分析方法,可以看到从左到右刚开始是比较偏正常思维的逻辑模型,然后就是贝叶斯、统计分类器这类比较简单的数学模型,以致后来发展到了随机过程这种正常人一般不太接触的东西。然后上下分为确定性和概率性两大分类,这么一个框图不但描述了RCA领域,其实对于很多领域的抽象模型宏观视图都有一定的借鉴价值。
关于model generation:Assisted generation:In most of the cases domain knowledge is partially available, for instance in the form of known models for sub-parts of the system that can be replicated several times and arbitrarily connected to other sub- parts. In these cases, the whole model is produced by assembling the models of the sub-parts based on available data of the system (i.e., available system knowledge), like its topology. In some cases these sub-models are not explicit in a library but implicit in the algorithm that, given the available system knowledge, generates the model for RCA. Assisted generation methods require a fair amount of domain knowledge in the form of a sub- model library and/or the specific composition algorithms, plus a detailed system information to be able to produce the final diagnosis model. Most of the RCA systems in the literature applied to industrial environments fall inside this category, as it offers a good compromise between the quality of manual specification and the automatization of the construction of the whole model.
关于模型的可解释性:
For rule sets, the concept of a good explanation is relatively simple: they can provide the conclusion to the user, together with all the rules fired to reach that conclusion from the symptoms. On the other hand, for Bayesian Networks the concept is not so clear. One possibility is to use the computed probabilities of each of the potential causes, their marginals, and take the one with maximum probability (or the group above a given threshold if multiple faults are allowed). How- ever this approach considers the aggregation of all possible worlds compatible with the observations, even if the real world can only be one of those states. In contrast, the Most Probable Explanation (MPE) just outputs the most probable compatible world, that is the assignment of all the variables in the model with highest probability, thus it is most meaningful when the model contains only causes and symptoms and all symptom values are known. The Maximum A Posteriori (MAP) lies somewhere in between the previous two: some of the variables can be abstracted, thus aggregating some of the worlds, before selecting the most probable one. This is done typically with intermediate variables not representing the potential causes or with symptoms for which we have no information, so that only the set of all potential causes is considered.
Recently new metrics have been proposed, like the Most Reasonable Explanation (MRE) or the Most Inforbable Ex- planation (MIE). All of them try to find, according to some goodness criteria, what subset of variables is the most infor- mative to the user to explain the observations, rather than the user having to provide that set beforehand as in MAP. However this more sophisticated explanations are not needed if the model has clear variables and/or values that are tied to failures, and the number of this potential causes is not very large. For instance, if the model shows the dependency between components and each component has an associated variable with two possible values, ok and failure, given some symptoms, computing the posterior marginal probabilities for each one of the variables in its failure state, or computing the MPE or the MAP would be a good option. The partic- ular selection between Marginals, MEP or MAP depends on whether variables not related to failures have to be abstracted or not and the number of faults that can happen concurrently: marginals would be a better option for single-fault diagnosis, while MPE and MAP are more suited for multiple failure scenarios. On the other hand, if variables represent simply different possible configuration options and none of them is inherently wrong, alternative explanation methods will try to automatically subset which variables had the largest influence in the observed symptoms.