Your website maybe stop working and response very lowly. How to find out the reason? Below are the guide, hope it will help you out!
Identify it is a hang
What website hang really means? An IIS website hangs whenever it appears to stop serving incoming requests, with requests either taking a very long time or timing out. It's generally caused by all available application threads becoming blocked, causing subsequent requests to get queued(or sometimes by the number of active reuqests exceeding configured concurrency limits).
There are three types of hangs which we should differentiate fist.
1. Full hang. All the requests are very slow or timeout.
Symptoms include detectable request queuing and sometimes 503 service unavailable errors when queue limits are reached. Most hang doesn't involve high CPU, and are often called "low CPU hangs". Also most of the time, high CPU does not itself cause a hang. In rare cases, you may also get a "high CPU hang", which we don't cover here.
2. Rolling hang. Most request are slow, but eventually load.
This usually occurs before a full hang develops, but may also represent a stable state for an application that is overloaded.
3. Slow requests. Only specific URLs in your application are slow.
This is not generally a true hang, but rather just a performance problem with as specific part of your application.
Below three signs are the hints of hang
1. Performance counter "Http Service Request QueuesMaxQueueItemAge"
It means IIS is falling behind in request processing if this counter keep increasing, so all incoming requests are waiting at least this long to begin getting processed.
2. Performance counter "Http Service Request QueuesArrivalRate" and "W3WP_W3SVCRequests / sec"
If "Http Service Request QueuesArrivalRate" exceeds "W3WP_W3SVCRequests / sec" for the application pool's worker process over a period of time. This basically implies that more requests are coming into the system than are being processed, and this always eventually results in queuing.
3. Snapshotting currently executing requests.
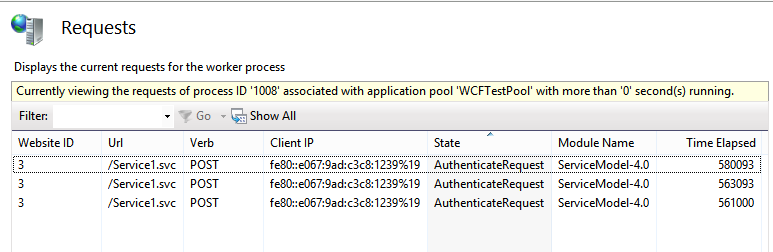
It is the best way to detect a hang. If the number of currently executing requests is growing, this can reliably tell you that requests are piling up which always lead to high latencies and request queuing. Most importantly, this can also tell you which Urls are causing the hang and which requests are queued. You can use GUI of InetMgr(IIS manager) or AppCmd tool to get this information.
Using InetMgr: Open IIS manager and navigate to server node, going to Worker Processes, and picking your application pool's worker process:
Using AppCmd: This tool is located at folder %windir%system32inetsrv, you run below command to get requets that have run at least 10 seconds.
appcmd list requests /elapsed:10000
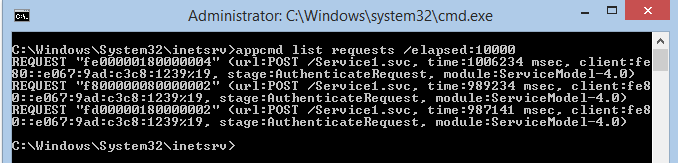
If you see mutiple requests that are taking a long time to execute AND you are seeing more and more requests begin to accumulate, you likely have a hang. If you don't see requests accumulating, it is likely that you have slow requests to some parts of your application, but you do not have a hang.
Diagnose the hang
1. Eliminate IIS as the source of hang
IIS hangs happen when all available IIS threads are blocked, causing IIS to stop dequeueing additional requests. This is rare these days, because IIS request threads almost never block. Instead, IIS hands off request processing to an Asp.Net, Classic ASP, or FastCGI application, freeing up its threads to dequeue more requests. We can use below performance counter eliminate IIS as source of the hang quickly:
"Http Service Request QueuesCurrentQueueSize", IIS is having no problems dequeuing requests if it is 0
"W3WP_W3SVCActive Threads" This will almost always be 0, or 1 because IIS threads almost never block. If it is significantly higher, you likely have IIS thread blockage due to a custom module or because you explicitly configured ASP.NET to run on IIS threads. Consider increasing your MaxPoolThreads registry key.
2. Snapshot the currently executing request to identify where blockage is taking place
From the resulting list of executing request (please use AppCmd or Inetmgr to get these information), we can know which URL is causing the blockage, and which requests are queued.
What code is causing the hang?(for developers)
At this point, you've confirmed the hang, and determined where in your application its located (e.g. URL). The next and final step is for the developer to figure out what in the application code is causing the hang.
Are you that developer? Then, you know how hard it is to make this final leap, because most of the time hangs are very hard to reproduce in the test environment. Because of this, you'll likely need to analyze the hang in production while its still happening.
Here is how:
- Make sure you have Windows Debugging Tools installed on the server (takes longer), or get ProcDump (faster).
Expert tip #3: It always pays to have these tools available on each production server ahead of time. Taking the dump approach is usually faster and poses less impact to your production process, letting you analyze it offline. However, taking a dump could be a problem if your process memory is many Gbs in size.
- Identify the worker process for the application pool having the hang. The executing request list will show you the process id if you run it with the /xml switch.
- Attach the debugger to the process, OR, snapshot a dump using procdump and load it in a debugger later.
// attach debugger live (if you are fast) ntsd -p [PID] // or take a dump to attach later procdump -ma -w [PID] c:dump.dmp ntsd -z c:dump.dmp - Snapshot the thread stacks, and exit. Make sure to detach before closing the debugger, to avoid killing the process!
.loadby sos clr .loadby sos mscorwks ~*e!clrstack .detach qq - The output will show you the code where each thread is currently executing. It will look like this:
OS Thread Id: 0x88b4 (7) RetAddr Call Site 000007fed5a43ec9 ASP.test_aspx.Page_Load(System.Object, System.EventArgs) 000007fee5a50562 System.Web.UI.Control.OnLoad(System.EventArgs) 000007fee5a4caec System.Web.UI.Control.LoadRecursive() 000007fee5a4beb0 System.Web.UI.Page.ProcessRequest() 000007ff001b0219 System.Web.UI.Page.ProcessRequest(System.Web.HttpContext) 000007fee5a53357 ASP.test_aspx.ProcessRequest(System.Web.HttpContext) 000007fee61fcc14 System.Web.Hosting.PipelineRuntime.ProcessRequestNotification(IntPtr, IntPtr, IntPtr, Int32) - Wait 10-20 seconds, and do it again. If you are taking a dump, just take two dumps 10 seconds or so apart.
Alright. Once you have the two thread stack lists, your objective is to find thread ids that have the same stack in both snapshots. These stacks show the code that is blocking the threads, and thereby causing the hang.
NOTE: If you are only seeing a couple threads or no threads with the same stack, its likely because you either a) have a rolling hang where requests are taking a while but are still moving, or b) your application is asynchronous. If its async, debugging hangs is WAY harder because its nearly impossible to tell where requests are blocked without stacks. In this case, you need to implement custom application tracing across async boundaries to help you debug hangs.
References
https://www.leansentry.com/Guide/IIS-AspNet-Hangs