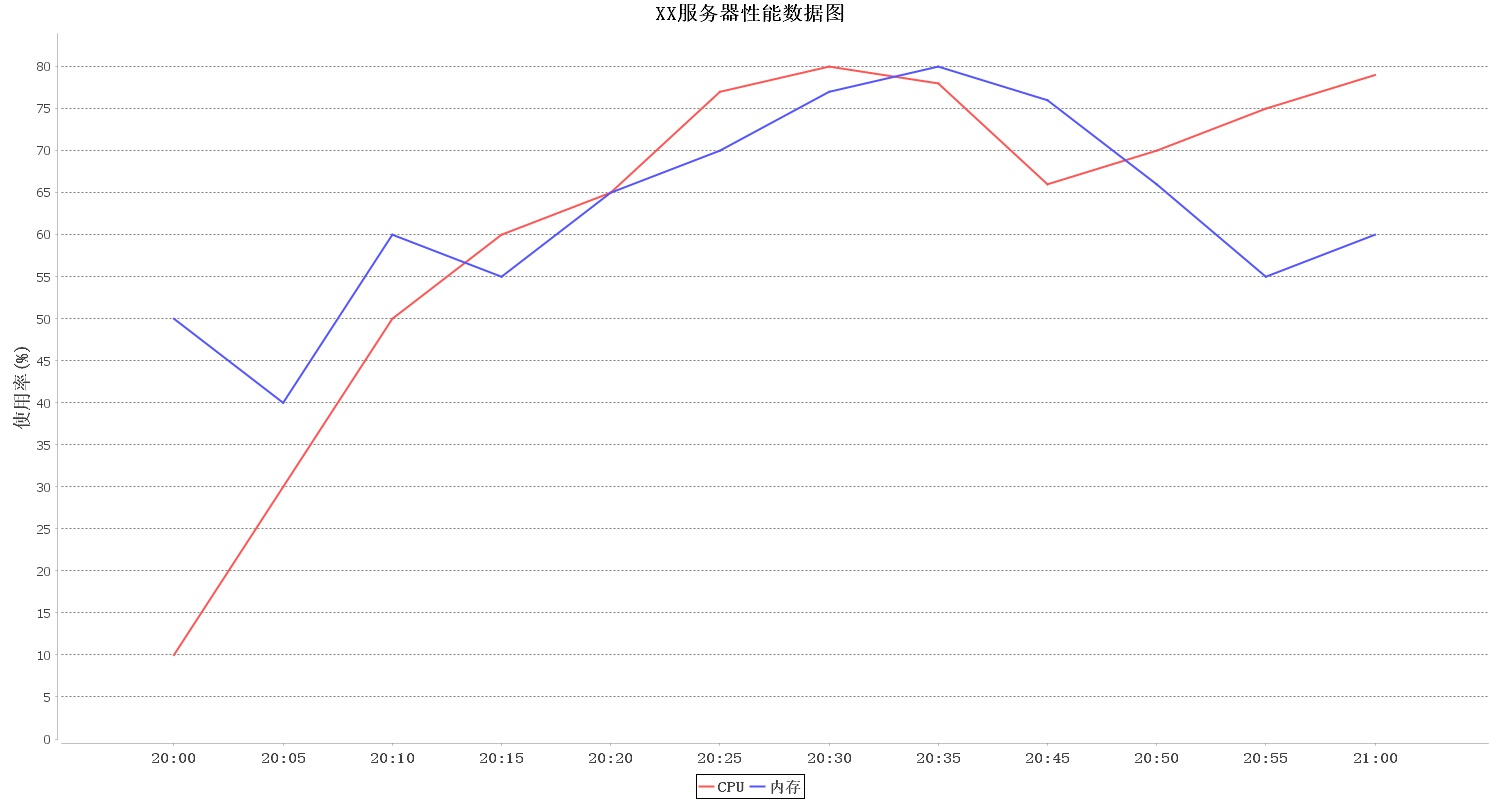
一、效果
二、代码
2.1、maven依赖
        <!--        lombok插件 start-->
        <dependency>
            <groupId>org.projectlombok</groupId>
            <artifactId>lombok</artifactId>
            <version>1.18.8</version>
            <scope>provided</scope>
        </dependency>
        <dependency>
            <groupId>org.jetbrains</groupId>
            <artifactId>annotations</artifactId>
            <version>RELEASE</version>
            <scope>compile</scope>
        </dependency>
        <!--        lombok插件 end-->
        <!--        poi 操作excel start-->
        <dependency>
            <groupId>org.apache.poi</groupId>
            <artifactId>poi</artifactId>
            <version>3.17</version>
        </dependency>
        <dependency>
            <groupId>org.apache.poi</groupId>
            <artifactId>poi-ooxml</artifactId>
            <version>3.17</version>
        </dependency>
        <!--        poi 操作excel end-->
        <!--       绘制图表 star-->
        <!-- https://mvnrepository.com/artifact/org.jfree/jfreechart -->
        <dependency>
            <groupId>org.jfree</groupId>
            <artifactId>jfreechart</artifactId>
            <version>1.0.19</version>
        </dependency>
        <!--        绘制图表 end-->
2.2、代码实现
原理:把获取到的服务器性能数据放到Excel表格中(获取方法),然后把表格中的数据通过JFree绘制成折线图
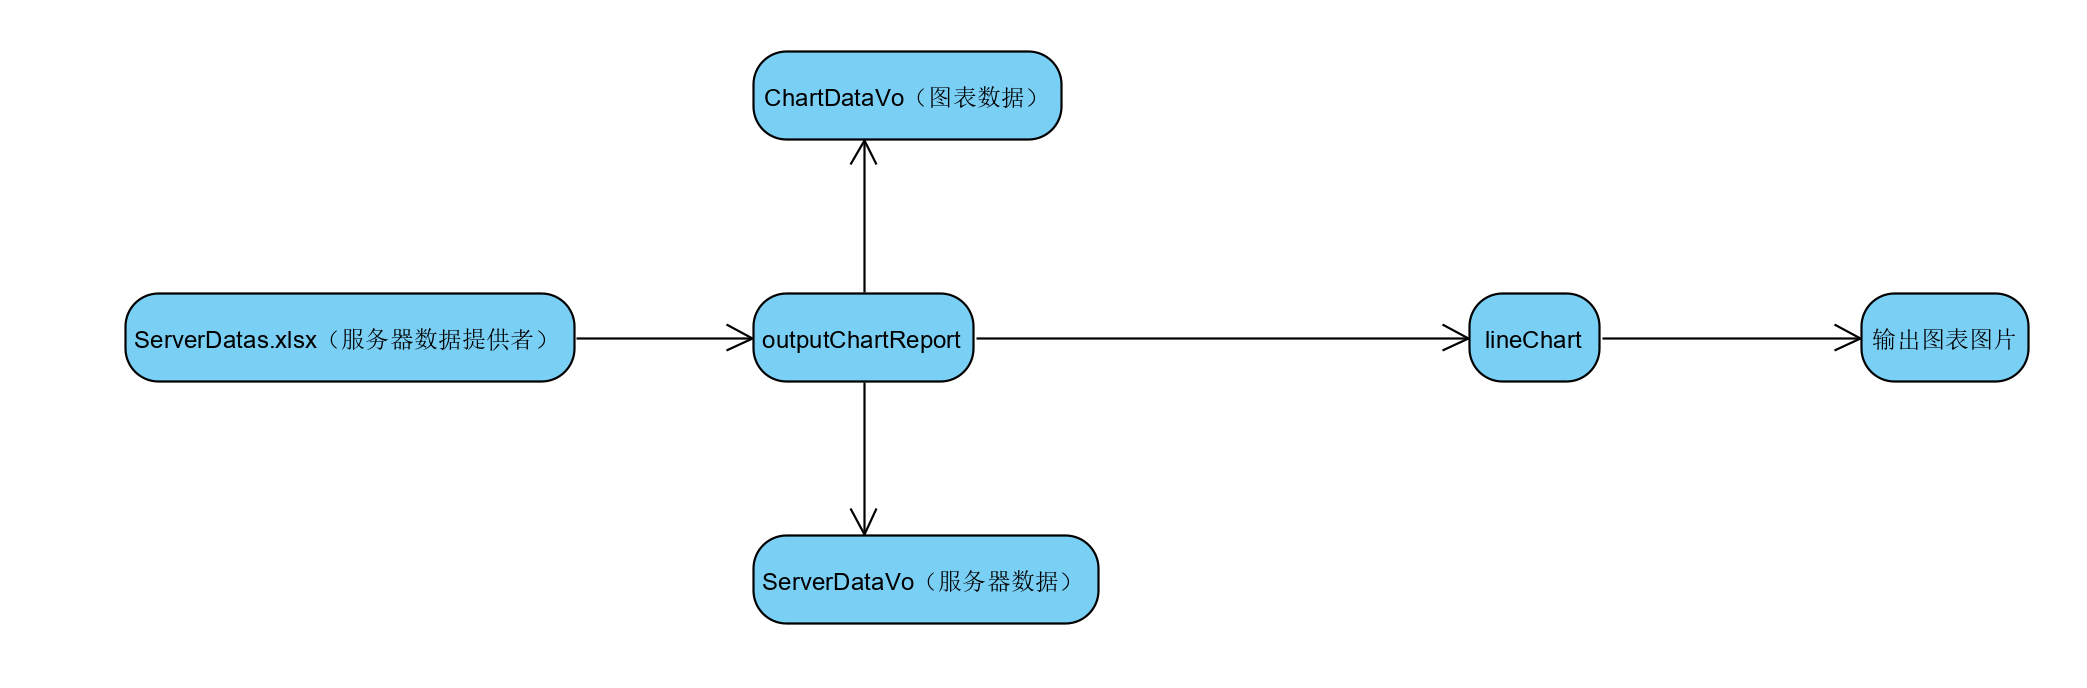
折线图绘制活动概要图
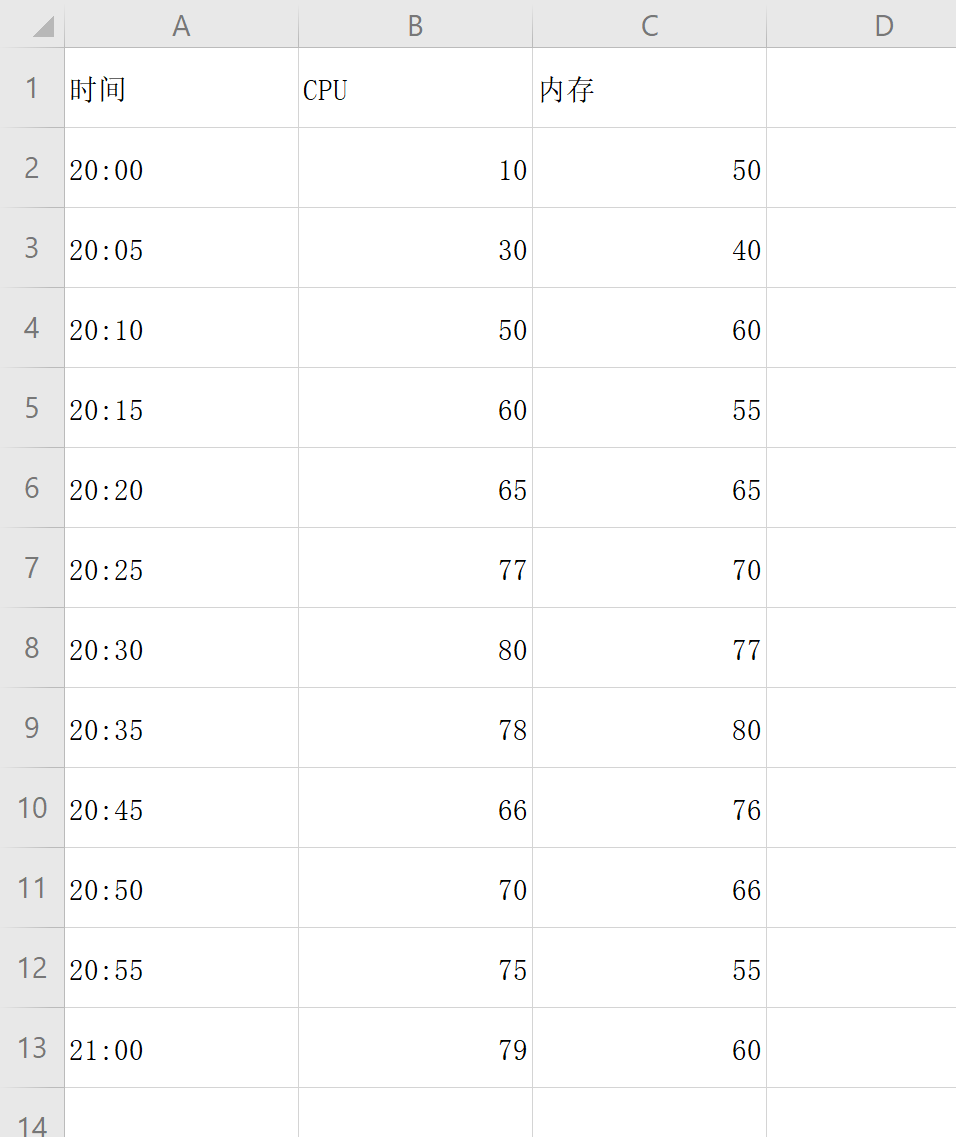
excel文件数据
ChartDataVo(图表数据)


package report;

import lombok.Data;
import org.testng.internal.collections.Pair;

import java.awt.*;
import java.util.List;


/**
 * @Author: Jarvis
 * @Date: 2020/6/17 12:24
 * @Version: v1.0.0
 * @Description: 图表数据
 */
@Data
public class ChartDataVo {
    String title; // 标题
    List<Pair<String, List<Pair<String, String>>>> dataList; // 数据
    String typeName; // 分类名称
    String units; // y轴单位
    Font font; // 字体
}
ServerDataVo(服务器数据)
package report;

import lombok.Data;


/**
 * @Author: Jarvis
 * @Date: 2020/6/16 20:52
 * @Version: v1.0.0
 * @Description: 服务器数据
 */
@Data
public class ServerDataVo {
    private String cpu;
    private String memory;
    private String date;
}
ChartReport
package report;

import java.awt.*;
import java.io.File;
import java.io.FileInputStream;
import java.io.IOException;
import java.util.*;
import java.util.List;

import org.apache.poi.xssf.usermodel.XSSFSheet;
import org.apache.poi.xssf.usermodel.XSSFWorkbook;
import org.jfree.chart.ChartFactory;
import org.jfree.chart.ChartUtilities;
import org.jfree.chart.JFreeChart;
import org.jfree.chart.plot.CategoryPlot;
import org.jfree.chart.plot.PlotOrientation;
import org.jfree.chart.renderer.category.CategoryItemRenderer;
import org.jfree.chart.title.LegendTitle;
import org.jfree.data.category.DefaultCategoryDataset;
import org.testng.internal.collections.Pair;


/**
 * @Author: Jarvis
 * @Date: 2020/6/16 18:02
 * @Version: v1.0.0
 * @Description: 输出各种图形图表(如折线图、柱状图等)
 */
public class ChartReport {
    private static final int EXCEL_DATA_DATE = 0;
    private static final int EXCEL_DATA_CPU = 1;
    private static final int EXCEL_DATA_MEMORY = 2;

    /**
     * 功能:获取Excel中服务器的性能数据
     * 备注:默认表格中的数据是按时间升序排列的
     *
     * @param excelPath 文件路径
     * @return
     */
    public static List<ServerDataVo> getServerDataByExcel(String excelPath) {
        ServerDataVo data;
        List<ServerDataVo> dataVoList = new ArrayList<>();

        try {
            FileInputStream fileInputStream = new FileInputStream(excelPath);
            XSSFWorkbook workbook = new XSSFWorkbook(fileInputStream);
            XSSFSheet sheet = workbook.getSheet("ServerData");
            int lastRowNum = sheet.getLastRowNum();
            // 遍历所有行
            for (int i = 1; i <= lastRowNum; i++) {
                data = new ServerDataVo();
                // 获取时间
                data.setDate(sheet.getRow(i).getCell(EXCEL_DATA_DATE).getStringCellValue());
                // 获取CPU
                data.setCpu(String.valueOf(sheet.getRow(i).getCell(EXCEL_DATA_CPU).getNumericCellValue()));
                // 获取内存
                data.setMemory(String.valueOf(sheet.getRow(i).getCell(EXCEL_DATA_MEMORY).getNumericCellValue()));

                dataVoList.add(data);
            }

            return dataVoList;
        } catch (IOException e) {
            e.printStackTrace();
        }

        return null;
    }


    /**
     * 功能:折线图
     *
     * @param outputReportPath 图表输出路径
     * @param chartDataVo      折线图基本样式及数据设置
     */
    public static void lineChart(String outputReportPath, ChartDataVo chartDataVo) {
        int lineTypeCount = 0; // 折线图的种类数量
        try {
            // 种类数据集
            DefaultCategoryDataset dcd = new DefaultCategoryDataset();
            // 折线图数据写入DefaultCategoryDataset
            for (Pair<String, List<Pair<String, String>>> da1 : chartDataVo.getDataList()) {
                lineTypeCount = da1.second().size();
                for (Pair<String, String> da2 : da1.second()) {
                    dcd.setValue(
                            Double.valueOf(da2.second()), // 当前种类的折线图值
                            da2.first(), // rowKey 当前折线图种类名称
                            da1.first() // columnKey 横坐标轴数据
                    );
                    System.out.println(String.format("%s-%s-%s",
                            Double.valueOf(da2.second()),
                            da2.first(),
                            da1.first()));
                }
            }

            //创建折线图,折线图分水平显示和垂直显示两种
            JFreeChart chart = ChartFactory.createLineChart(chartDataVo.getTitle(), chartDataVo.typeName, chartDataVo.getUnits(), dcd,//2D折线图
                    PlotOrientation.VERTICAL,
                    true, true, true);
//            JFreeChart chart = ChartFactory.createLineChart3D(title, typeName, units, dcd,//3D折线图
//                    PlotOrientation.VERTICAL,
//                    true, true, false);

            //设置整个图片的标题字体
            chart.getTitle().setFont(chartDataVo.getFont());

            // 得到折线示例标识
            chartDataVo.setFont(new Font("宋体", Font.BOLD, 15));
            Font font = chartDataVo.getFont();
            font = new Font("宋体", Font.BOLD, 15);
            LegendTitle legend = chart.getLegend();
            legend.setItemFont(font); // 设置折线示例标识字体
//            legend.setItemPaint(Color.WHITE); // 折线示例标识字体颜色
//            legend.setBackgroundPaint(null); // 折线示例标识背景

            // 设置图表外层背景色
//            chart.setBackgroundPaint(new Color(56, 56, 56));

            //得到绘图区
            CategoryPlot plot = (CategoryPlot) chart.getPlot();
            //得到绘图区的域轴(横轴),设置标签的字体
            plot.getDomainAxis().setLabelFont(font);
            //设置横轴标签项字体
            plot.getDomainAxis().setTickLabelFont(font);
//            plot.setBackgroundPaint(null); // 设置绘图区的背景色
            plot.setOutlineVisible(false); // 设置绘图区的边框
            plot.setBackgroundAlpha(0.0f); // 设置绘图区背景透明度
            plot.setForegroundAlpha(1.0f); // 设置图形中折线的透明度(0.0f - 1.0f)
            //设置范围轴(纵轴)字体
            font = new Font("宋体", Font.BOLD, 18);
            plot.getRangeAxis().setLabelFont(font);
            plot.setDomainGridlinesVisible(false); // 是否显示绘图区纵轴网格线
            plot.setRangeGridlinesVisible(true); // 是否显示绘图区横轴网格线
            plot.setRangeGridlinePaint(Color.BLACK); // 设置绘图区横轴网格线颜色

            // 得到线条
            CategoryItemRenderer renderer = plot.getRenderer();
            // 设置折线图中所有线条的宽度
            for (int i = 0; i < lineTypeCount; i++) {
                renderer.setSeriesStroke(i, new BasicStroke(2F)); // 设置第i个折线的宽度
            }

            //存储成图片
            ChartUtilities.saveChartAsJPEG(new File(outputReportPath), chart, 1500, 800);
        } catch (Exception e) {
            e.printStackTrace();
        }
    }

    /**
     * 功能:读取表格中的服务器数据并生成图表
     *
     * @param excelPath        服务器数据
     * @param outputReportPath 图表输出路径
     */
    public static void outputChartReport(String excelPath, String outputReportPath) {
        List<ServerDataVo> serverDataList = getServerDataByExcel(excelPath);
        List<Pair<String, List<Pair<String, String>>>> data = new ArrayList<>();
        ChartDataVo chartDataVo = new ChartDataVo();

        List<Pair<String, String>> da;
        // 折线图每列数据
        for (int i = 0; i < serverDataList.size(); i++) {
            da = new ArrayList<>();
            da.add(new Pair<>("CPU", serverDataList.get(i).getCpu())); // CPU折线图纵轴数据
            da.add(new Pair<>("内存", serverDataList.get(i).getMemory())); // 内存折线图纵轴数据
            data.add(new Pair<>(serverDataList.get(i).getDate(), da)); // 横轴数据
        }

        Font font = new Font("宋体", Font.BOLD, 20);
        chartDataVo.setTitle("XX服务器性能数据图");
        chartDataVo.setDataList(data);
        chartDataVo.setTypeName("");
        chartDataVo.setUnits("使用率(%)");
        chartDataVo.setFont(font);
        ChartReport.lineChart(outputReportPath, chartDataVo);
    }

    public static void main(String[] args) {
        String excelPath = "src/main/java/report/ServerDatas.xlsx";
        String outputReportPath = "lineReport.png";
        outputChartReport(excelPath, outputReportPath);
    }

}