Hystrix的监控平台
了实现容错功能,Hystrix还提供了近乎实时的监控,HystrixCommand和
HystrixObservableCommand在执行时,会生成执行结果和运行指标。比如每秒的请求数量,成功数
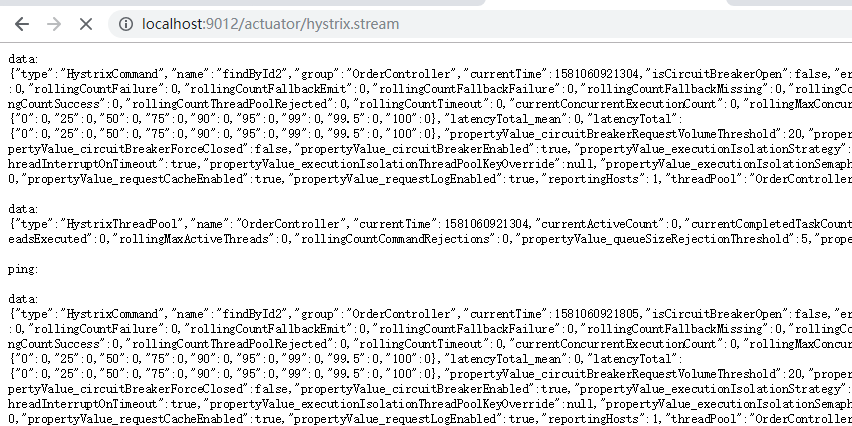
量等。这些状态会暴露在Actuator提供的/health端点中。只需为项目添加 spring -boot-actuator 依
赖,重启项目,访问 http://localhost:9012/actuator/hystrix.stream ,即可看到实时的监控数据。
搭建Hystrix DashBoard监控
刚刚讨论了Hystrix的监控,但访问/hystrix.stream接口获取的都是已文字形式展示的信息。很难通过文
字直观的展示系统的运行状态,所以Hystrix官方还提供了基于图形化的DashBoard(仪表板)监控平
台。Hystrix仪表板可以显示每个断路器(被@HystrixCommand注解的方法)的状态。
1)导入依赖
<dependency>
            <groupId>org.springframework.boot</groupId>
            <artifactId>spring-boot-starter-actuator</artifactId>
        </dependency>
<dependency>
            <groupId>org.springframework.cloud</groupId>
            <artifactId>spring-cloud-starter-netflix-hystrix</artifactId>
        </dependency>
        <dependency>
            <groupId>org.springframework.cloud</groupId>
            <artifactId>spring-cloud-starter-netflix-hystrix-dashboard</artifactId>
        </dependency>
( 2)添加EnableHystrixDashboard 注解
在启动类使用@EnableHystrixDashboard注解激活仪表盘项目
@SpringBootApplication
@EntityScan("com.topcheer.order.entity")
@EnableFeignClients
@EnableHystrix
@EnableHystrixDashboard
public class OrderApplication {

    /**
     * 使用spring提供的RestTemplate发送http请求到商品服务
     *      1.创建RestTemplate对象交给容器管理
     *      2.在使用的时候,调用其方法完成操作 (getXX,postxxx)
     * * @LoadBalanced : 是ribbon提供的负载均衡的注解
     */
    @LoadBalanced
    @Bean
    public RestTemplate restTemplate() {
        return new RestTemplate();
    }

    public static void main(String[] args) {
        SpringApplication.run(OrderApplication.class,args);
    }
}
management:
  endpoints:
    web:
      exposure:
        include: '*'
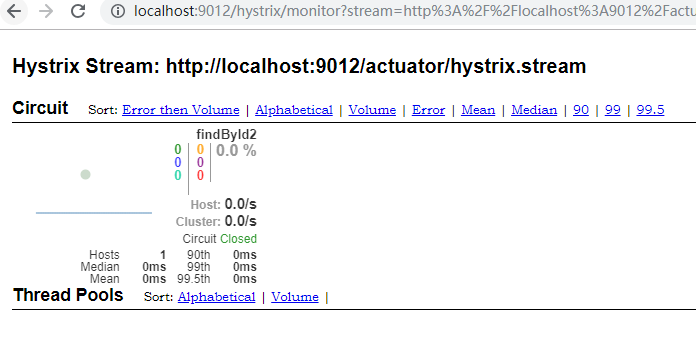
( 3)访问测试
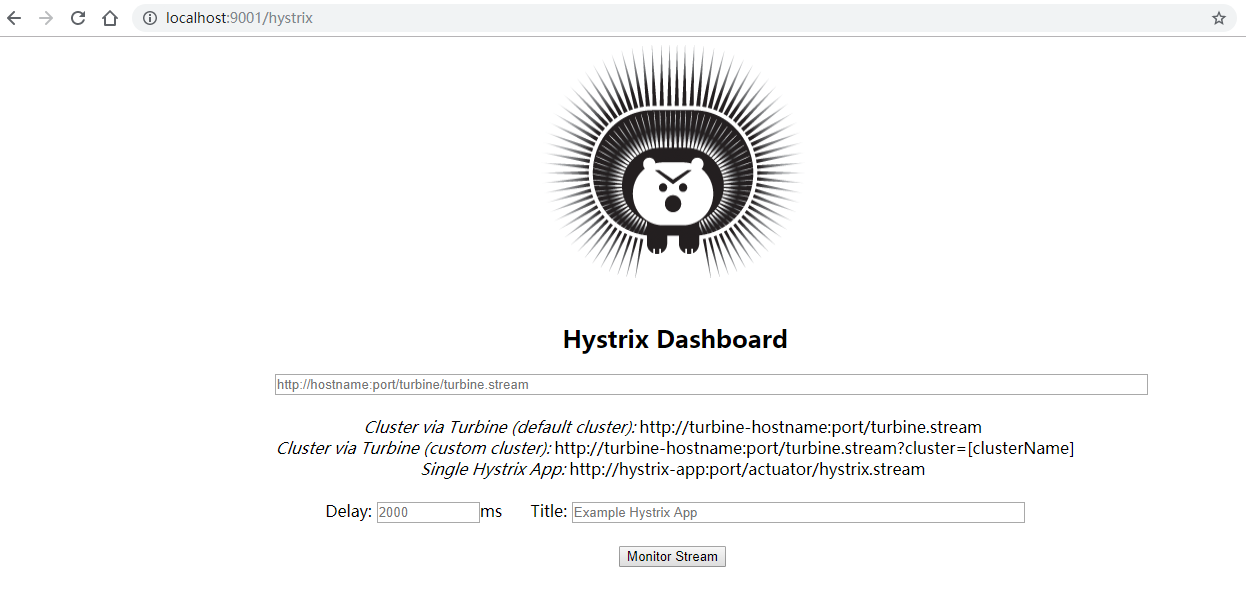
输入监控断点展示监控的详细数据

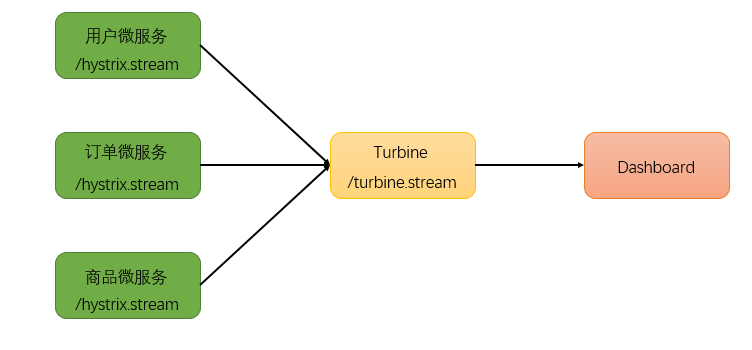
断路器聚合监控Turbine
在微服务架构体系中,每个服务都需要配置Hystrix DashBoard监控。如果每次只能查看单个实例的监
控数据,就需要不断切换监控地址,这显然很不方便。要想看这个系统的Hystrix Dashboard数据就需
要用到Hystrix Turbine。Turbine是一个聚合Hystrix 监控数据的工具,他可以将所有相关微服务的
Hystrix 监控数据聚合到一起,方便使用。引入Turbine后,整个监控系统架构如下:
( 1) 搭建TurbineServer
创建工程 shop_hystrix_turbine 引入相关坐标
<dependencies>
        <dependency>
            <groupId>org.springframework.cloud</groupId>
            <artifactId>spring-cloud-starter-netflix-turbine</artifactId>
        </dependency>
        <dependency>
            <groupId>org.springframework.cloud</groupId>
            <artifactId>spring-cloud-starter-netflix-hystrix</artifactId>
        </dependency>
        <dependency>
            <groupId>org.springframework.cloud</groupId>
            <artifactId>spring-cloud-starter-netflix-hystrix-dashboard</artifactId>
        </dependency>
    </dependencies>
( 2) 配置多个微服务的hystrix监控
在application.yml的配置文件中开启turbine并进行相关配置
server:
  port: 8031
spring:
  application:
    name: hystrix-turbine
eureka:
  client:
    service-url:
      defaultZone: http://localhost:9010/eureka/
  instance:
    prefer-ip-address: true
turbine:
  # 要监控的微服务列表,多个用,分隔
  appConfig: service-order
  clusterNameExpression: "'default'"
eureka 相关配置 : 指定注册中心地址
turbine 相关配置:指定需要监控的微服务列表
turbine会自动的从注册中心中获取需要监控的微服务,并聚合所有微服务中的 /hystrix.stream 数据
(3)配置启动类
@SpringBootApplication
//trubin配置
@EnableTurbine
@EnableHystrixDashboard
public class TurbinAppliation {

    public static void main(String[] args) {
        SpringApplication.run(TurbinAppliation.class,args);
    }
}
作为一个独立的监控项目,需要配置启动类,开启 HystrixDashboard监控平台,并激活Turbine
(4) 测试
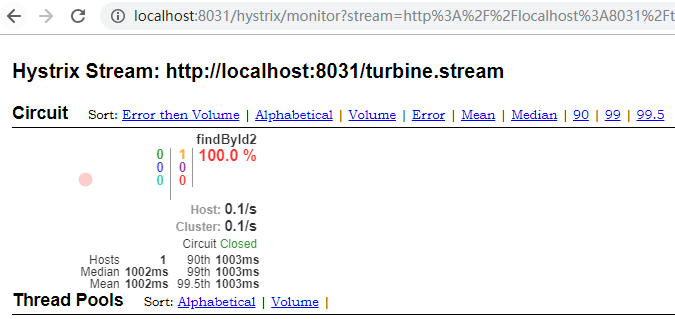
浏览器访问 http://localhost:8031/hystrix 展示HystrixDashboard。并在url位置输入 http://local
host:8031/turbine.stream ,动态根据turbine.stream数据展示多个微服务的监控数据