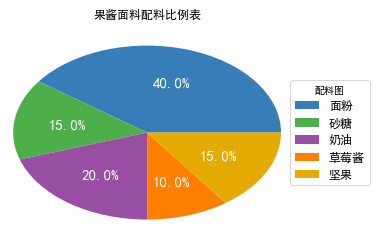
import matplotlib.pyplot as plt
import matplotlib as mpl

mpl.rcParams["font.sans-serif"] = ["SimHei"]
mpl.rcParams["axes.unicode_minus"] = False

elements = ["面粉", "砂糖", "奶油", "草莓酱", "坚果"]

weight = [40, 15, 20, 10, 15]

colors = ["#377eb8", "#4daf4a", "#984ea3", "#ff7f00", "#e6ab02"]

wedges, texts, autotexts = plt.pie(weight,
                                   autopct="%3.1f%%",
                                   textprops=dict(color="w"),
                                   colors=colors)

plt.legend(wedges,
           elements,
           fontsize=12,
           title="配料图",
           loc="center left",
           bbox_to_anchor=(0.91, 0, 0.3, 1))

plt.setp(autotexts, size=15, weight="bold")
plt.setp(texts, size=12)

plt.title("果酱面料配料比例表")

plt.show()