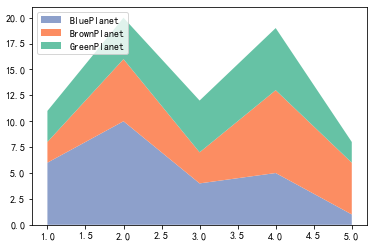
import matplotlib.pyplot as plt
import numpy as np

x = np.arange(1, 6, 1)
y = [6, 10, 4, 5, 1]
y1 = [2, 6, 3, 8, 5]
y2 = [3, 4, 5, 6, 2]

labels = ["BluePlanet", "BrownPlanet", "GreenPlanet"]
colors = ["#8da0cb", "#fc8d62", "#66c2a5"]

plt.stackplot(x, y, y1, y2, labels=labels, colors=colors)

plt.legend(loc="upper left")

plt.show()