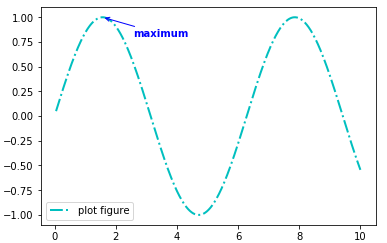
函数功能:添加图形内容细节的指向型注释文本。
调用签名:plt.annotate(string, xy=(np.pi/2, 1.0), xytext=((np.pi/2)+0.15, 1,5), weight="bold", color="b", arrowprops=dict(arrowstyle="->", connectionstyle="arc3", color="b"))
string:图形内容的注释文本
xy:被注释图形内容的位置坐标
xytext:注释文本的位置坐标
weight:注释文本的字体粗细风格
color:注释文本的字体颜色
arrowprops:指示被注释内容的箭头的属性字典
代码实现:
import matplotlib.pyplot as plt
import numpy as np

x = np.linspace(0.05, 10, 1000)
y = np.sin(x)

plt.plot(x, y, ls="-.", lw=2, c="c", label="plot figure")

plt.legend()

plt.annotate("maximum", xy=(np.pi/2, 1.0), xytext=((np.pi/2)+1.0, .8),
             weight="bold", color="b",
             arrowprops=dict(arrowstyle="->", connectionstyle="arc3", color="b"))

plt.show()