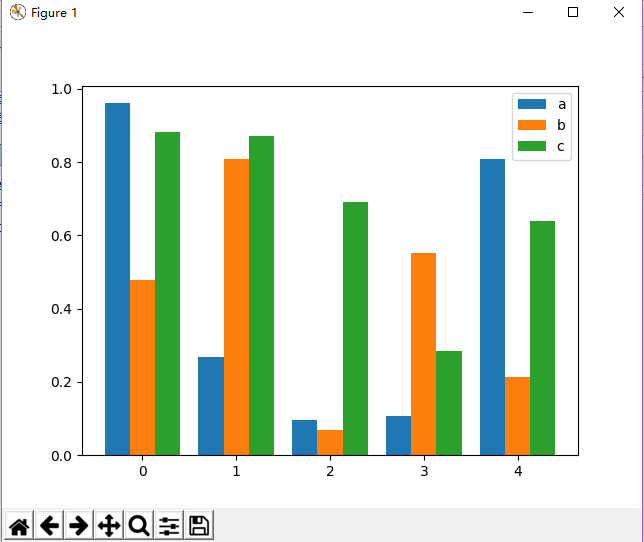
 1 import numpy as np
 2 import matplotlib.pyplot as plt
 3 size = 5
 4 a = np.random.random(size)
 5 b = np.random.random(size)
 6 c = np.random.random(size)
 7 d = np.random.random(size)
 8 x = np.arange(size)
 9
10 total_width, n = 0.8, 3     # 有多少个类型,只需更改n即可
11 width = total_width / n
12 x = x - (total_width - width) / 2
13
14 plt.bar(x, a,  width=width, label='a')
15 plt.bar(x + width, b, width=width, label='b')
16 plt.bar(x + 2 * width, c, width=width, label='c')
17 plt.legend()
18 plt.show()