npm install echarts --save
然后在需要引用的组件中引入echart
var echarts = require("echarts");
mounted:function(){
this.init();
console.log(123)
},
methods:{
init:()=>{
var echarts = require('echarts');
// 基于准备好的dom,初始化echarts实例
var myChart = echarts.init(document.getElementById('main'));
// 绘制图表
myChart.setOption({
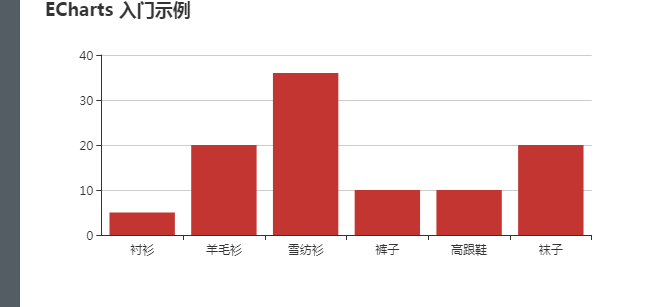
title: {
text: 'ECharts 入门示例'
},
tooltip: {},
xAxis: {
data: ['衬衫', '羊毛衫', '雪纺衫', '裤子', '高跟鞋', '袜子']
},
yAxis: {},
series: [{
name: '销量',
type: 'bar',
data: [5, 20, 36, 10, 10, 20]
}]
});
}