echarts_部分图表配置_dataZoom精确控制显示数据数量

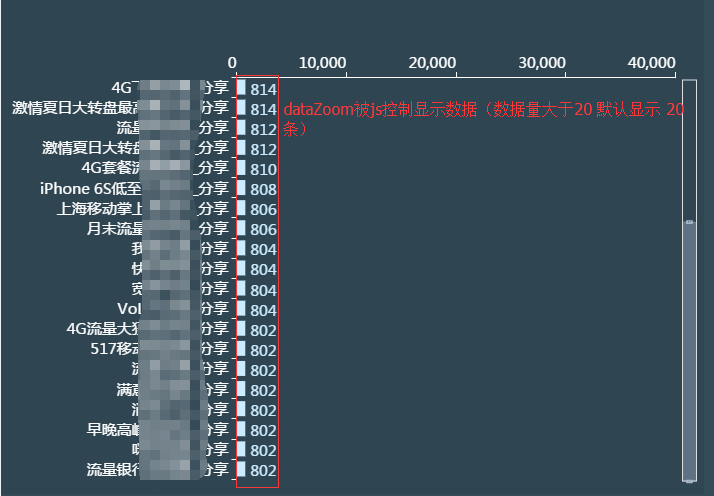
echarts为我们提供了dataZoom组件,当数据过多时就有了它的用武之地,业务场景:数据返回100调可是为了前端显示效果默认只显示20条,其他数据由dataZoom控制显示隐藏:

function Z_bar (thisId,titleName){
    var sdate=$("#sdate_id").val();
    var edate=$("#edate_id").val();
    var flag= $("#selectIndex").val();
    $.ajax({
        type : "POST",
        url : "../../shareTouch/shareTouchSum.do",
        async : false,
        data:{'sdate' : sdate,
            'edate' : edate,
            'flag' :flag},
        success : function(result, resultState){
            
            //默认显示20条数据(当数据多余20条时)s
            if(result.length >20 ){
                var dataZoom_end = (20/result.length)*100;
            }else{
                var dataZoom_end = 100;
            }
            
        if (resultState == "success") {
            var num = new Array();
            var name = new Array();
            var resultJson = eval(result);
            $.each(resultJson, function(i, item) {
                var y = new Object();
                var x = new Object();
                y=item.num;
                x=item.nv;
                name.push(x);
                $("#touchName").prepend("<option value='"+x+"'>"+x+"</option>");//追加触点名称选择option
                num.push(y);
            });
            $("#touchName").children().eq(0).attr("selected","selected");
    var myChart = echarts.init(document.getElementById(thisId));
    option = {
            backgroundColor: '#2f4552',
            textStyle:{
                color:'#fff',
                fontSize:'16'
             },
            
            tooltip: {
                trigger: 'axis',
                axisPointer: {
                    type: 'shadow'
                }
            },
            legend: {

                textStyle:{
                    color:'#fff',
                 },
               /* data: [titleName],*/
            },
            grid: {
                left: '3%',
                right: '4%',
                bottom: '3%',
                containLabel: true
            },
            xAxis: {
                color:'#fff',
                splitLine : {//去掉网格线
                    show : false
                },
                position: 'top',//X轴位置
                type: 'value',
                boundaryGap: [0, 0.01],
                axisLabel : {
                    show : true,
                    textStyle : {
                        color : '#FFF',
                        align : 'right',
                        fontSize: 15
                    }
                },
                axisLine : {
                    lineStyle : {
                        color : '#FFF'
                    }
                },
                axisTick : {
                    lineStyle : {
                        color : '#FFF'
                    }
                },
            },
            yAxis: {
                
                type: 'category',
                data: name,
                axisLabel : {
                    show : true,
                    textStyle : {
                        color : '#FFF',
                        align : 'right',
                        fontSize: 15
                    }
                },
                axisLine : {//设置轴线

                    lineStyle : {
                        color : '#FFF'
                    }
                },
                axisTick : {//设置刻度
                    lineStyle : {
                        color : '#FFF'
                    }
                },

            },
            dataZoom: [
                       {
                           
                           '15',
                           start:0,
                           end:dataZoom_end,
                           type: 'slider',
                           yAxisIndex: 0,
                           filterMode: 'empty',
                           textStyle:{
                               color:'#fff',
                               fontSize:'16'
                           }
                       }
                   ],
            series: [
                {
                    name: titleName,
                    type: 'bar',
                    data: num,
                    
                    label : {
                        normal : {
                            show : true,//显示数字
                            position : 'right'
                        }
                    },
                    
                    barWidth : 15,//柱子宽度
                    itemStyle : {
                        normal : {
                            color:'#ccecff',//柱状的颜色
                            label : {
                                  textStyle : {
                                      fontSize : '15',//柱状上的显示的文字大小
                                      color:'#ccecff'
                                  }
                              }
                        }
                    },

                }


            ]
        };

            myChart.setOption(option);
}
}
})
}

官网对于dataZoom介绍:http://echarts.baidu.com/option.html#dataZoom

dataZoom数据窗口范围的起始百分比。范围是:0 ~ 100。表示 0% ~ 100%。其实我只是添加了请求成功后的if判断,20是我设置的显示条数,这个可以作为参数传进来或者后端数据发送回来这样更动态一点,然后就实现数据显示的控制喽。

原文地址:https://www.cnblogs.com/cy3664983/p/7280579.html